Real answers · Real data · No hallucinations

Plain language.
Instant charts & answers.

Every screenshot below is a real IQVigilant answer to a plain-language question — charts, conversations, and analytical insights, all generated from your data model's metadata with no code, no data engineering, and no guessing.

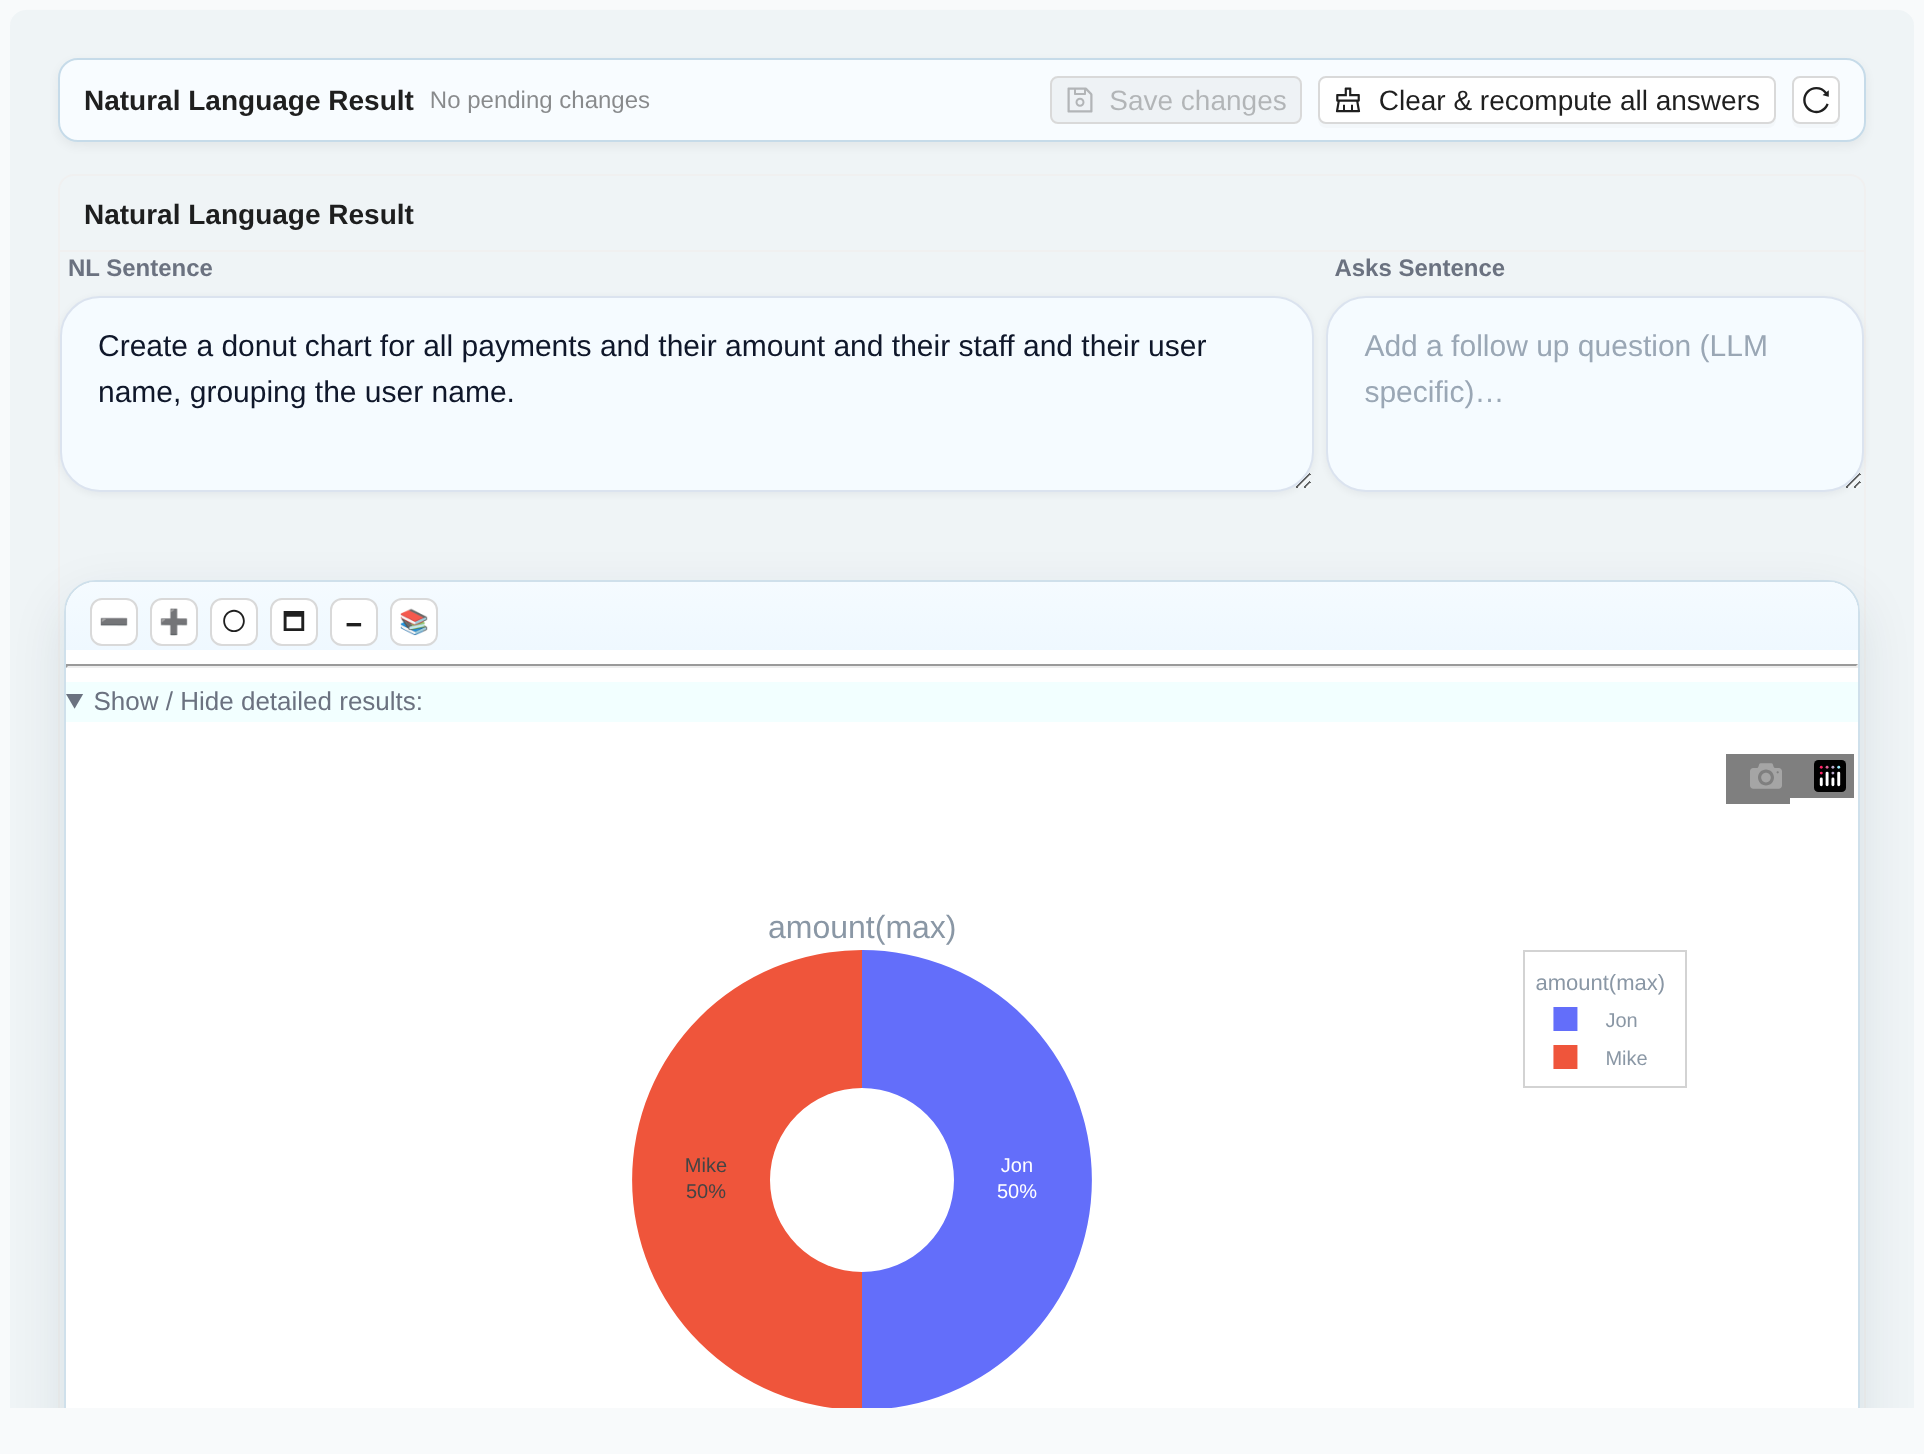
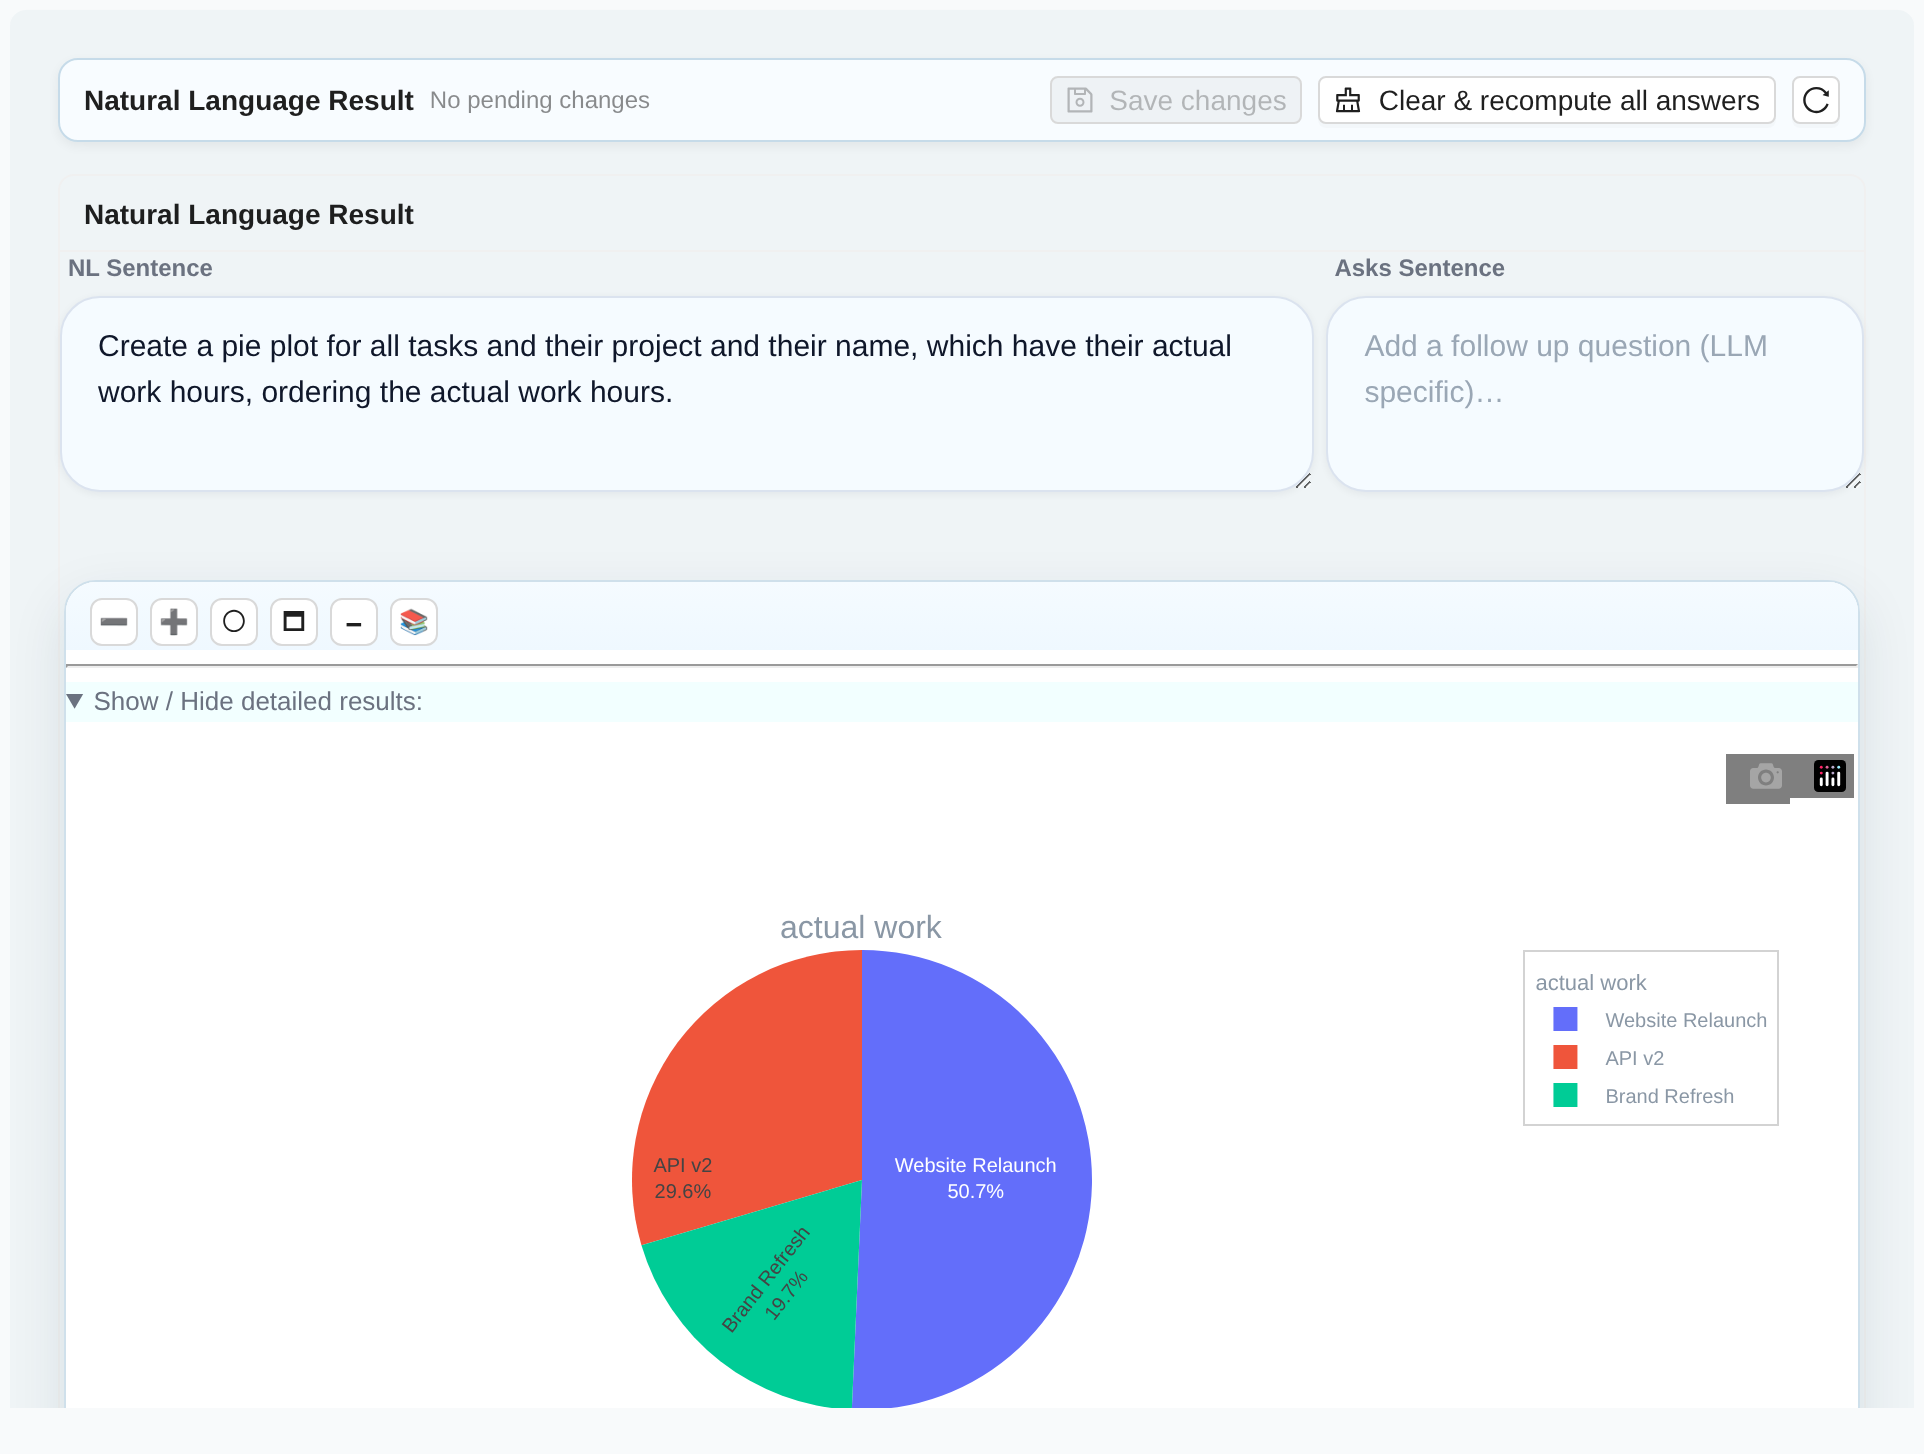
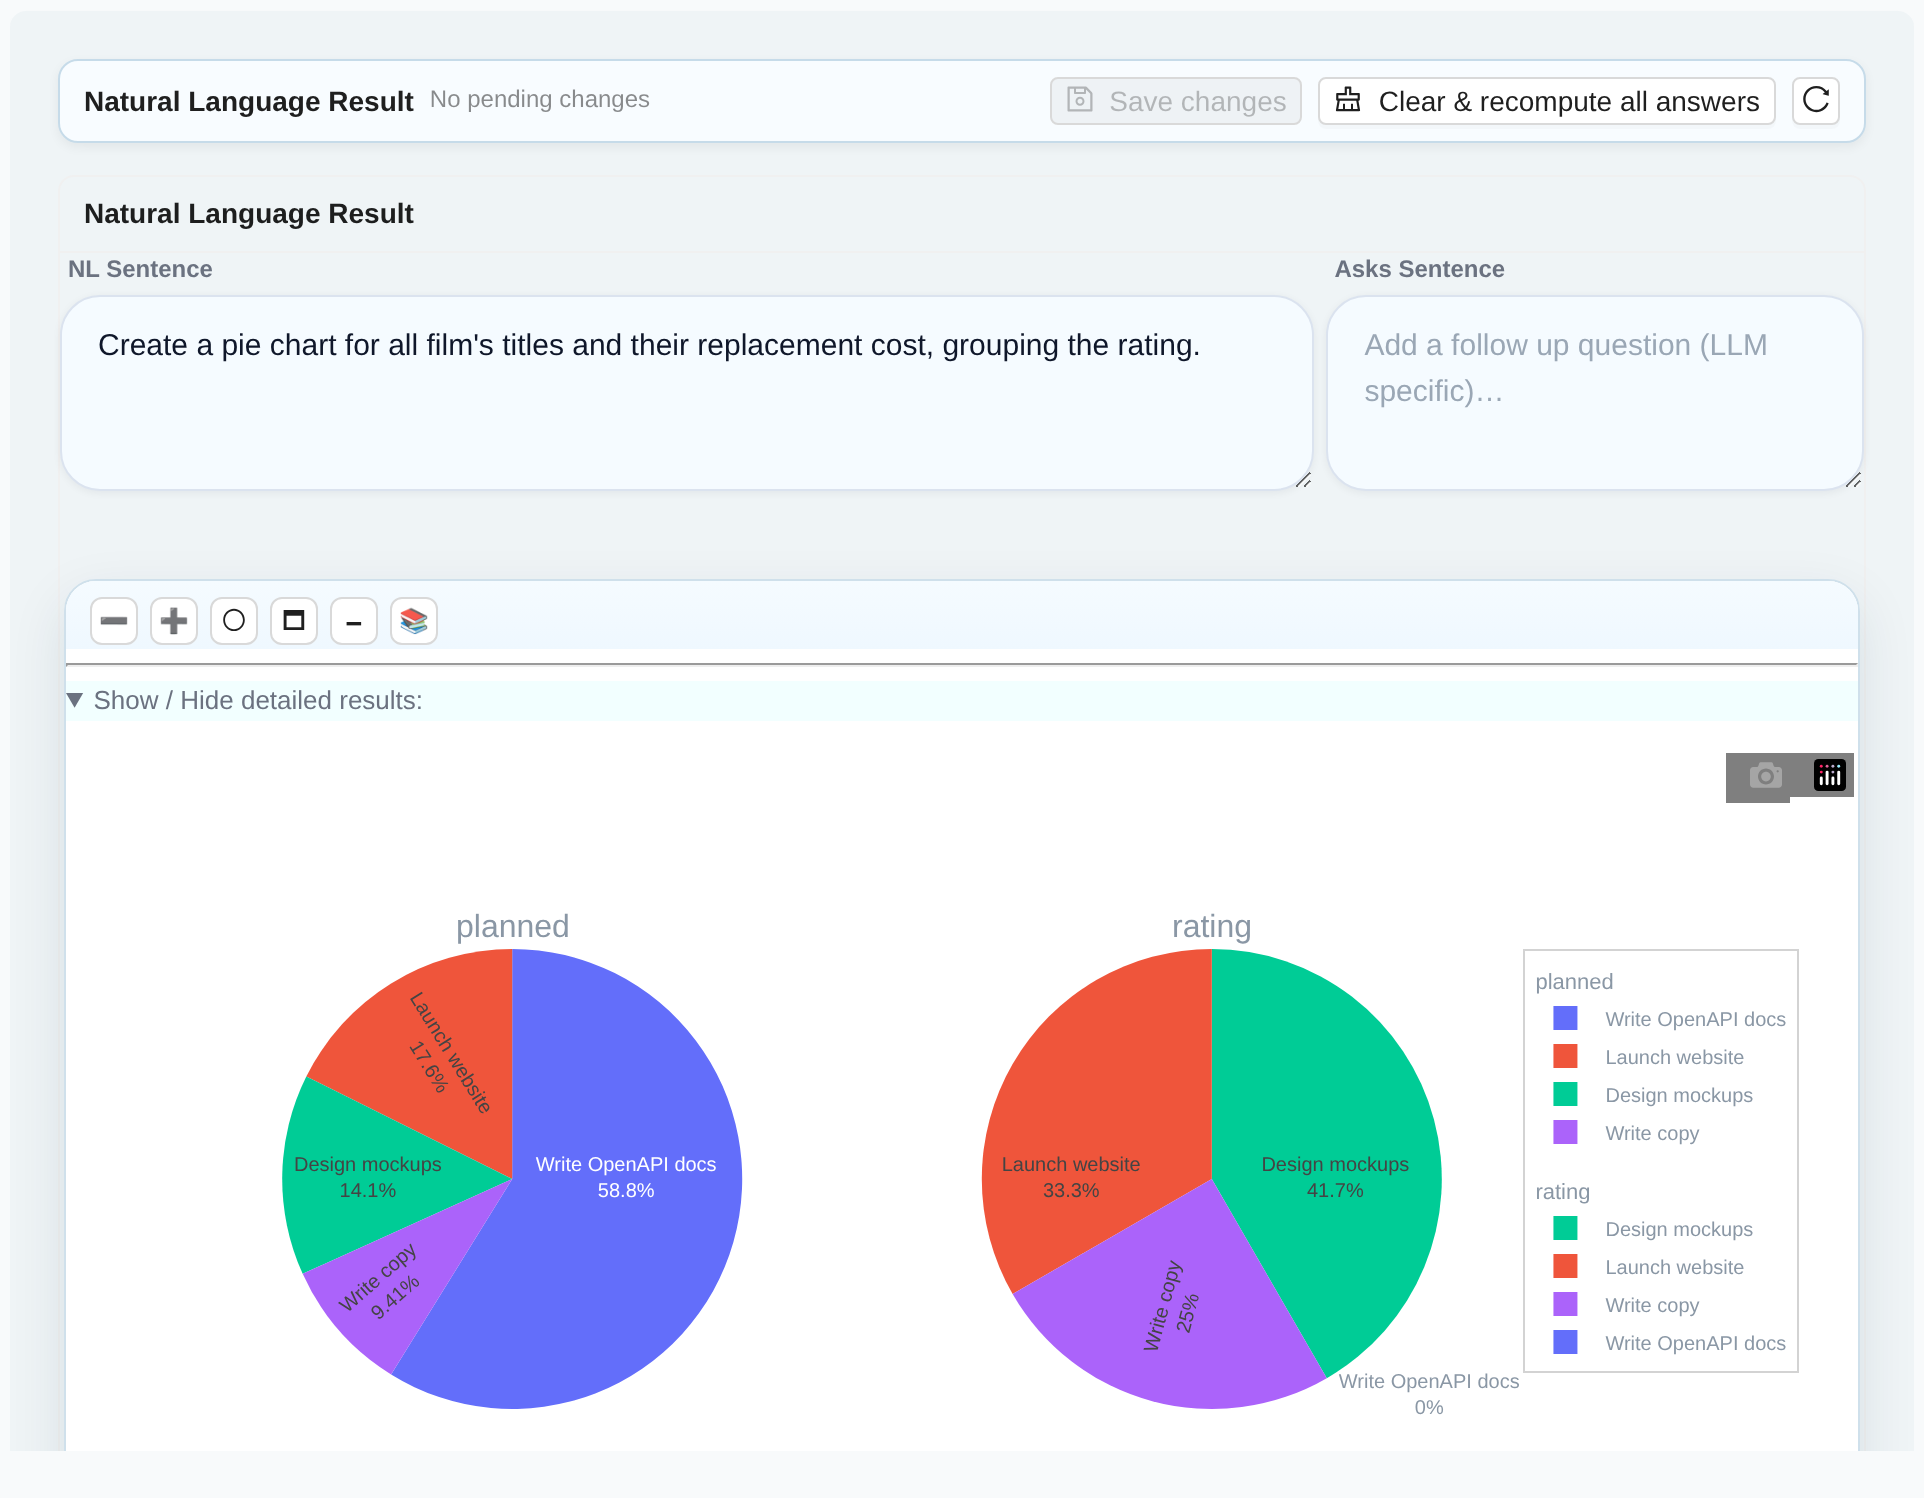
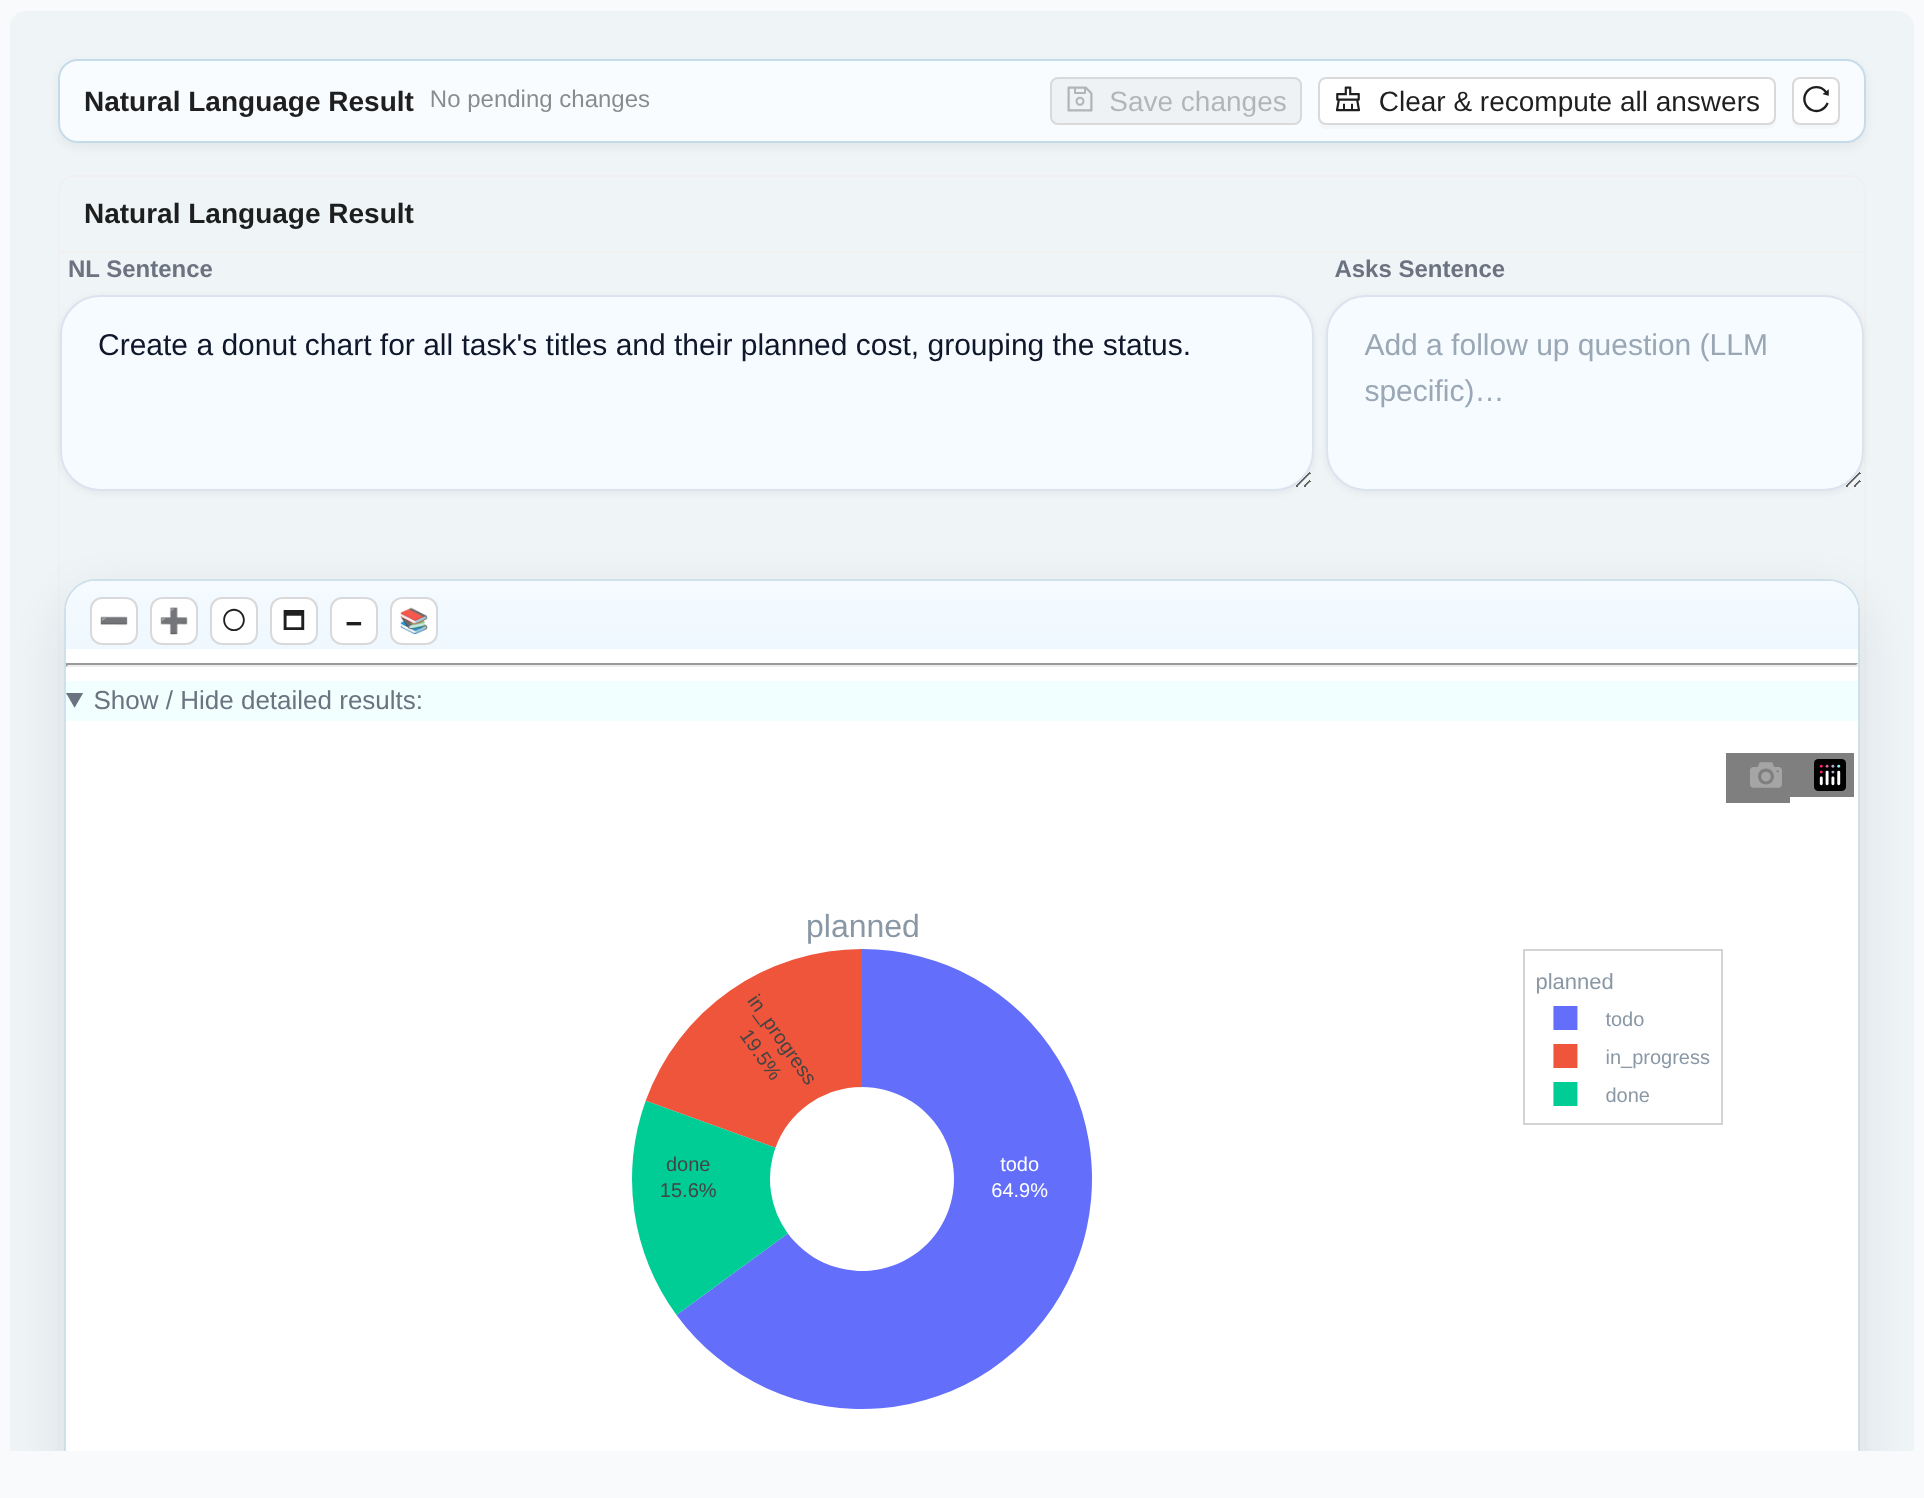
Donut & Pie

Proportional charts that show part-to-whole relationships at a glance.
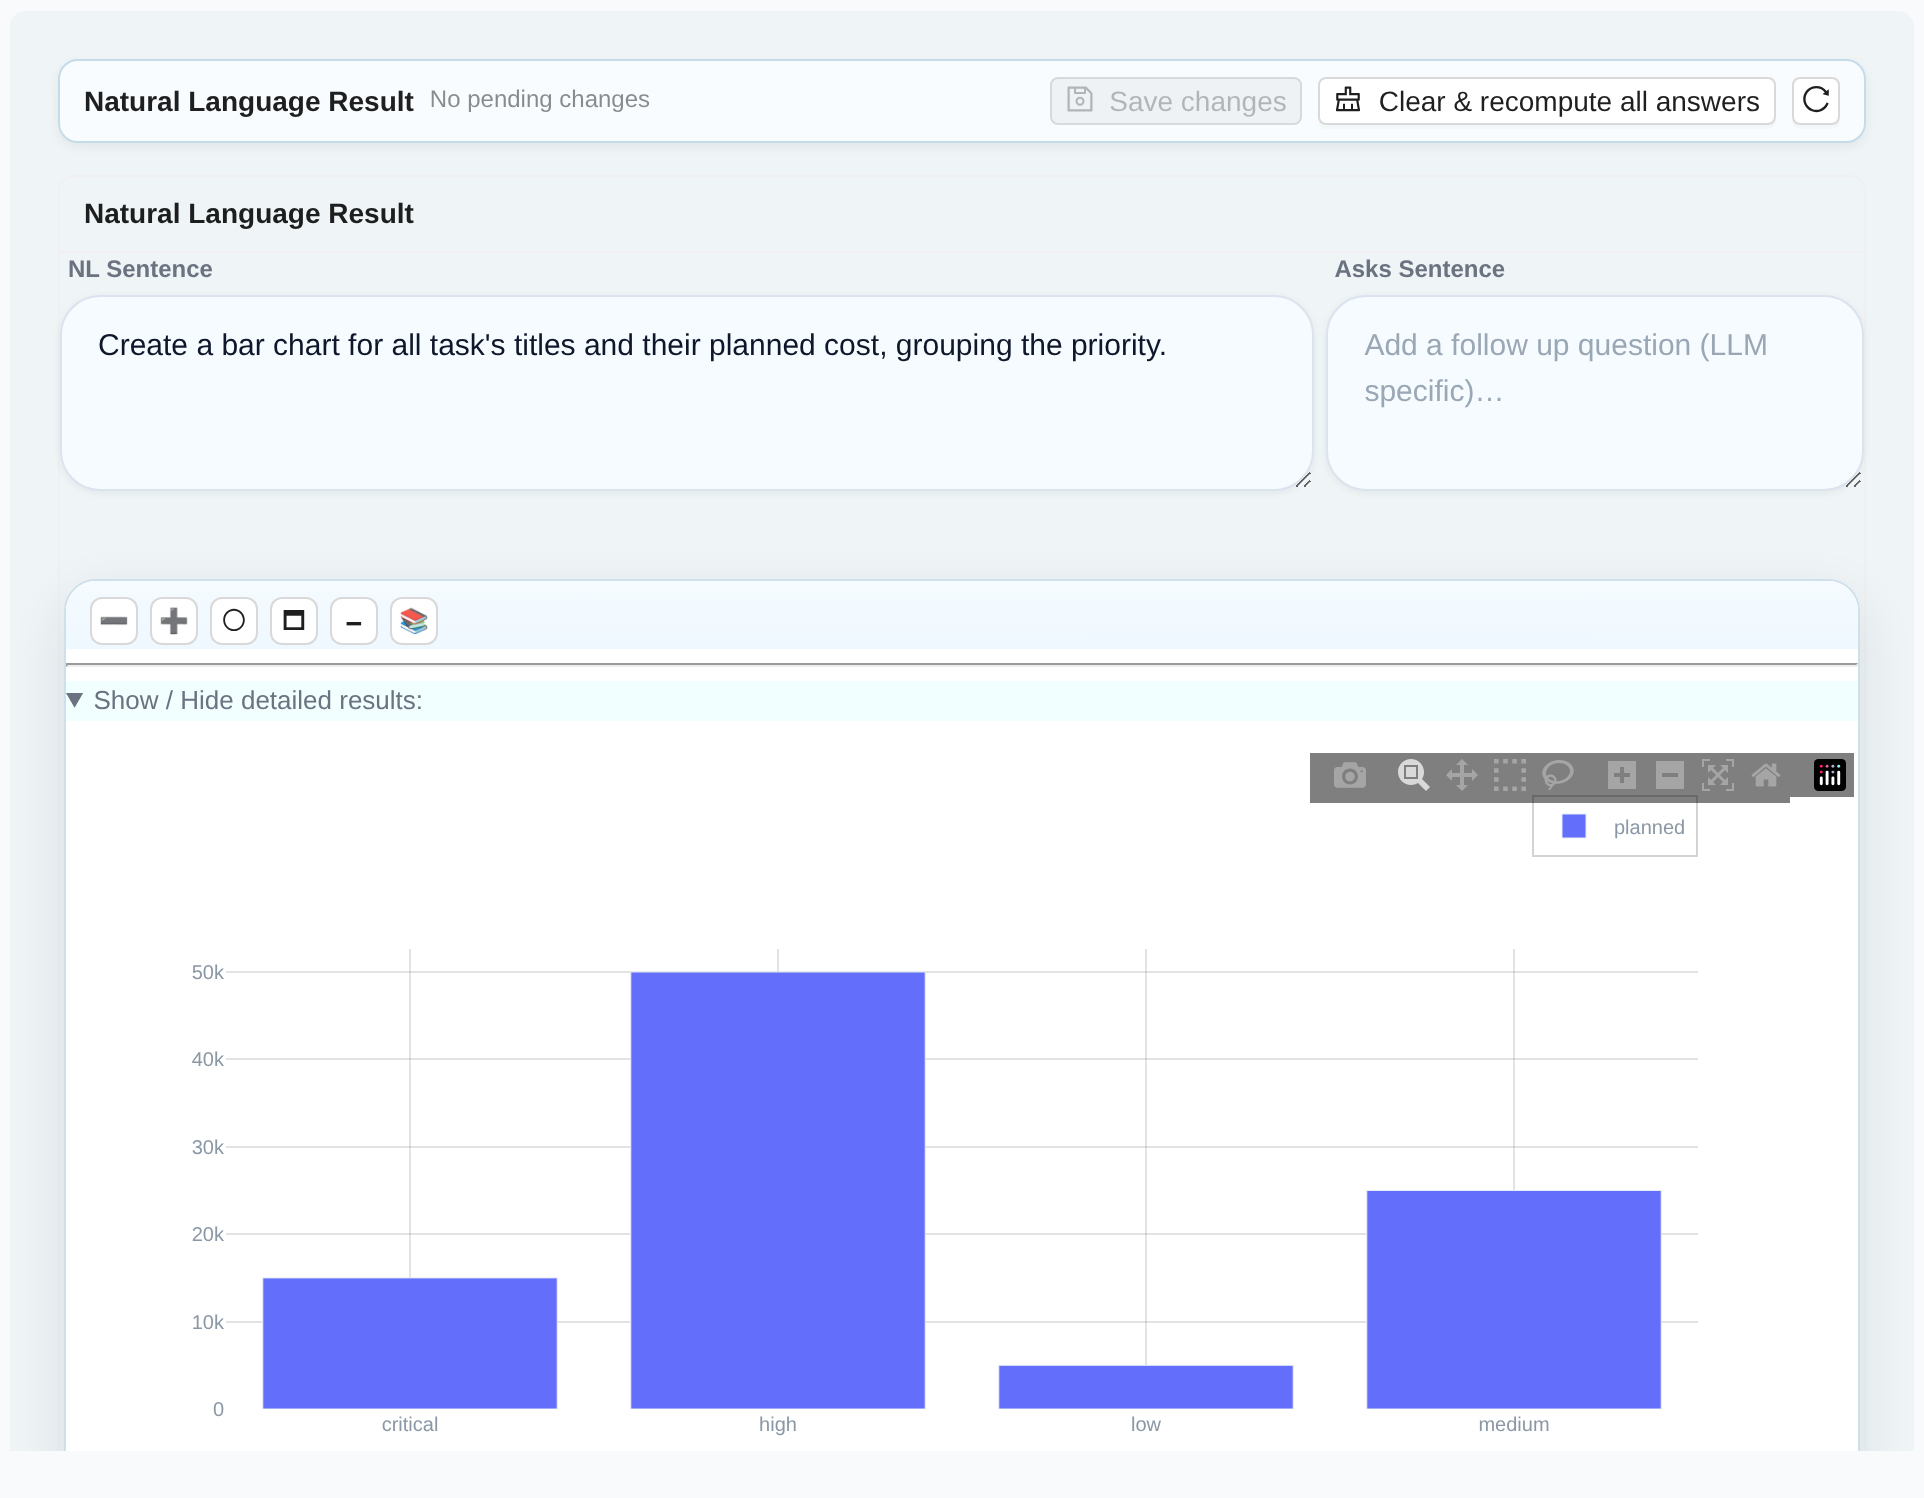
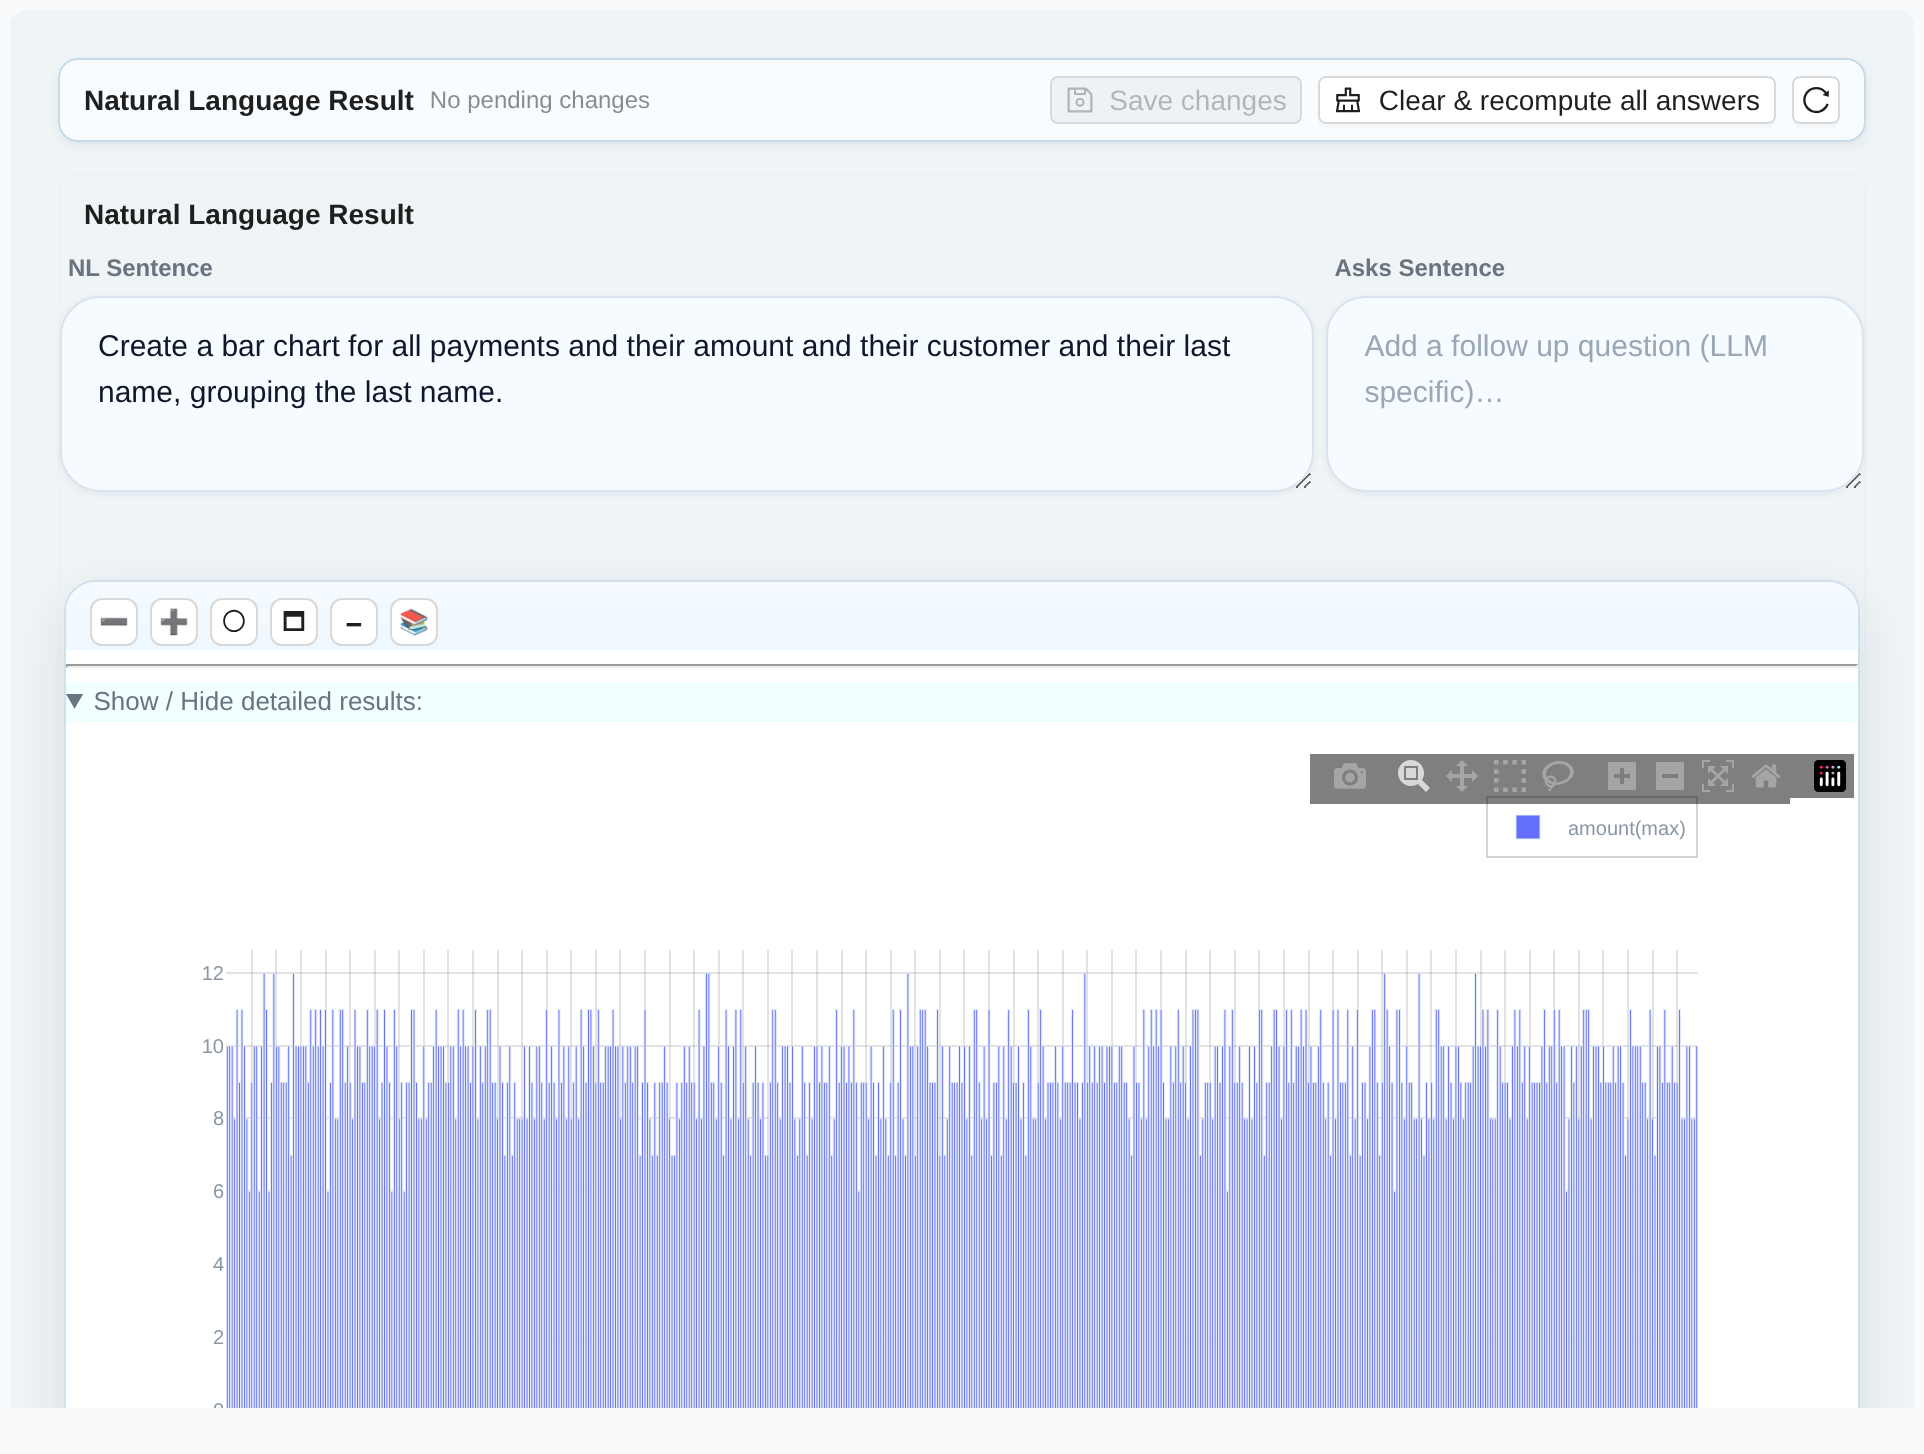
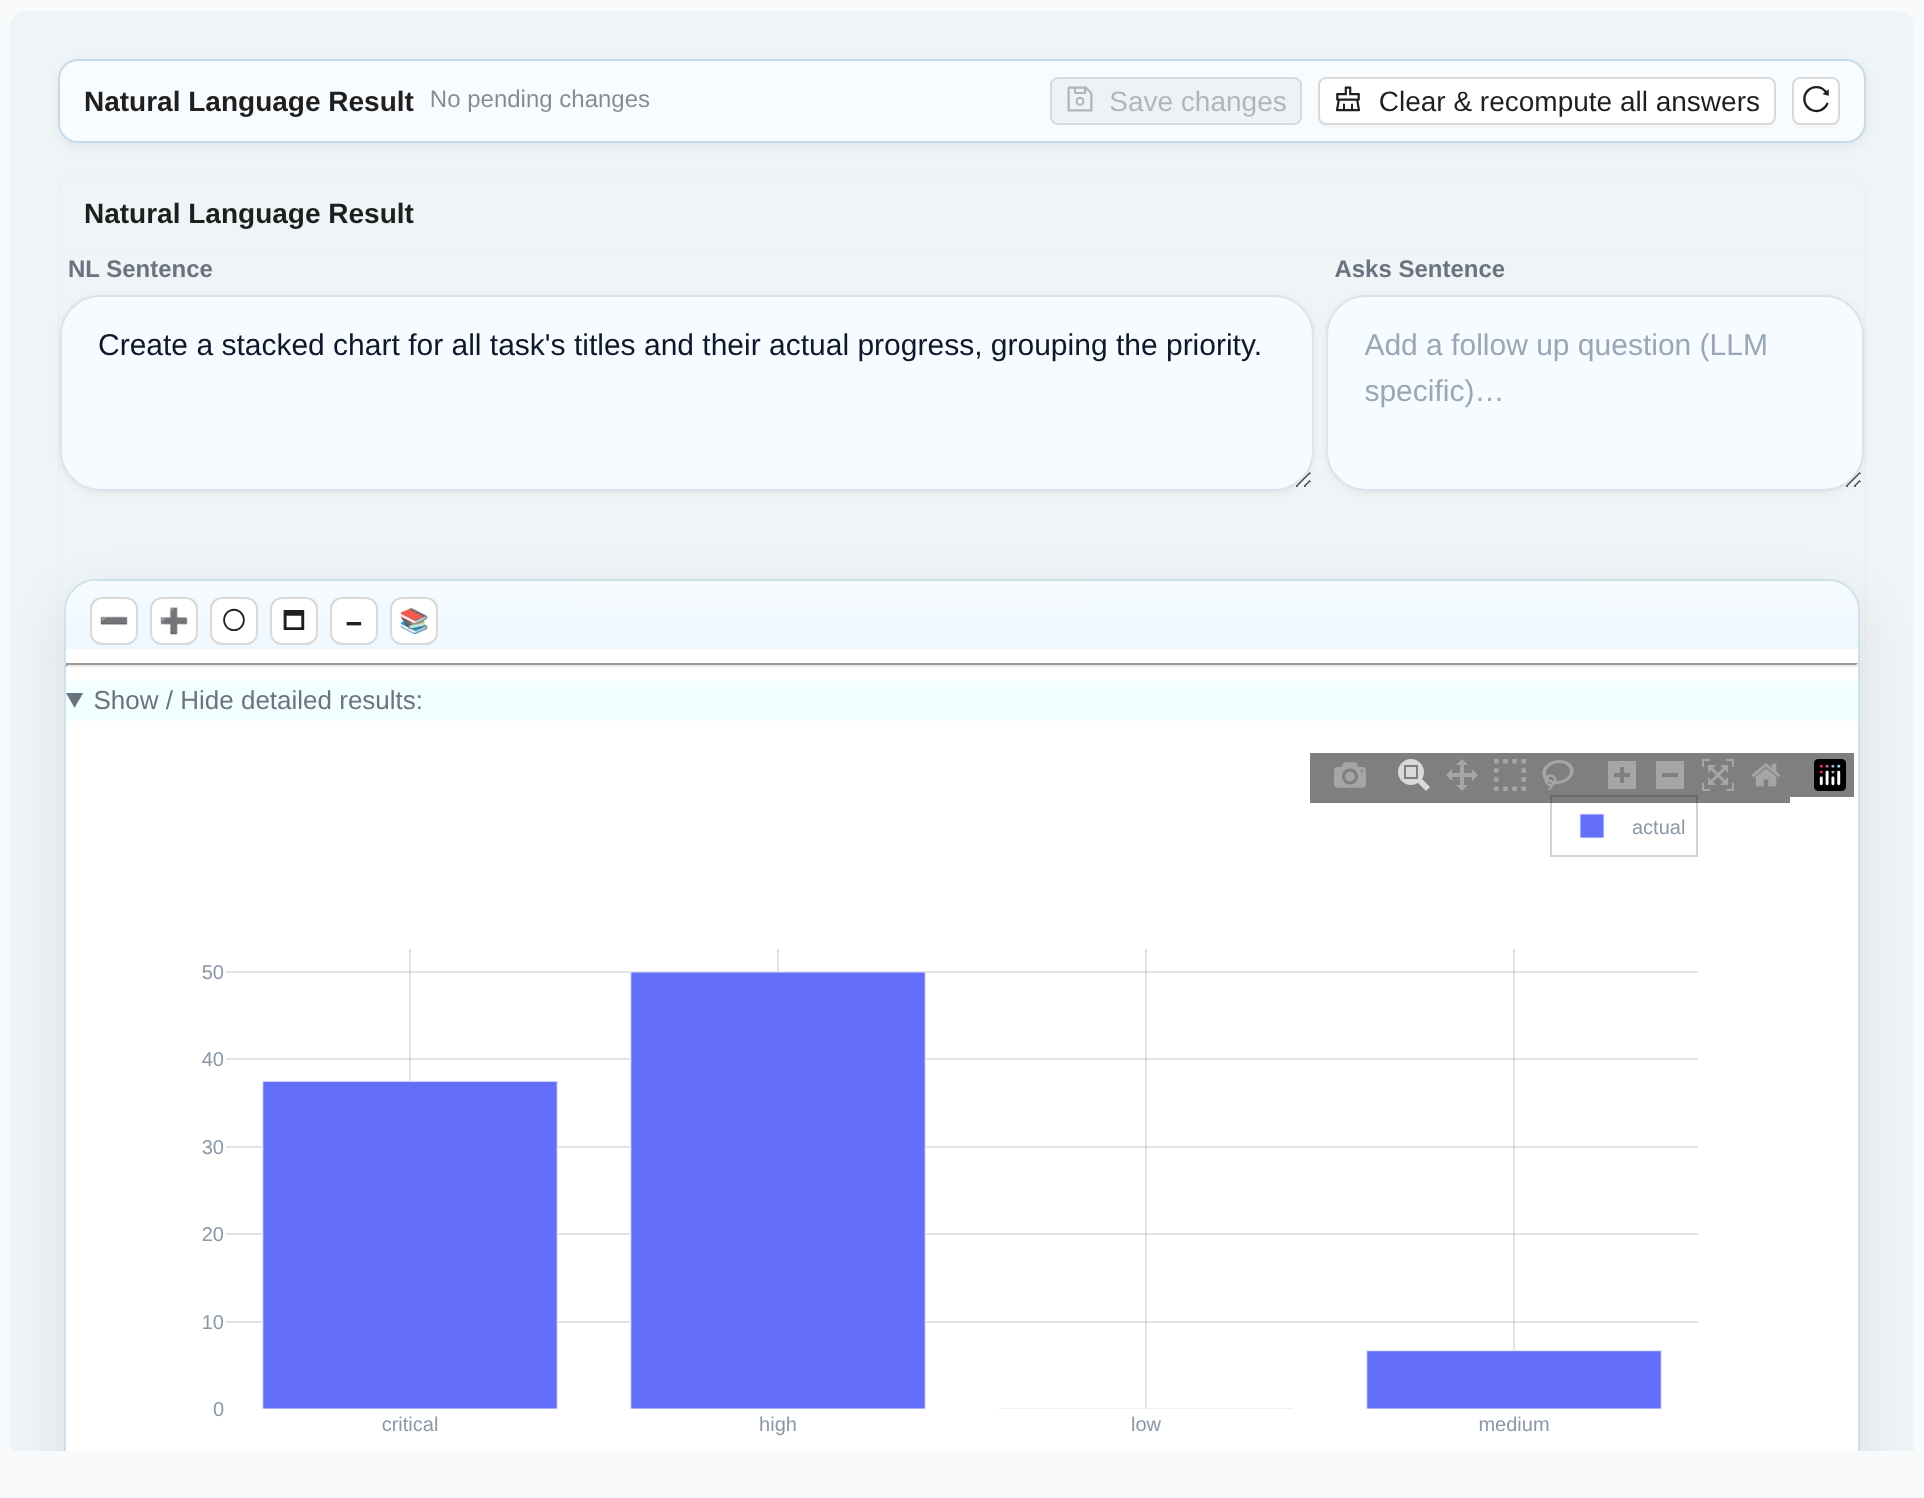
Bar & Stacked

Compare magnitudes across categories with bar and stacked layouts.

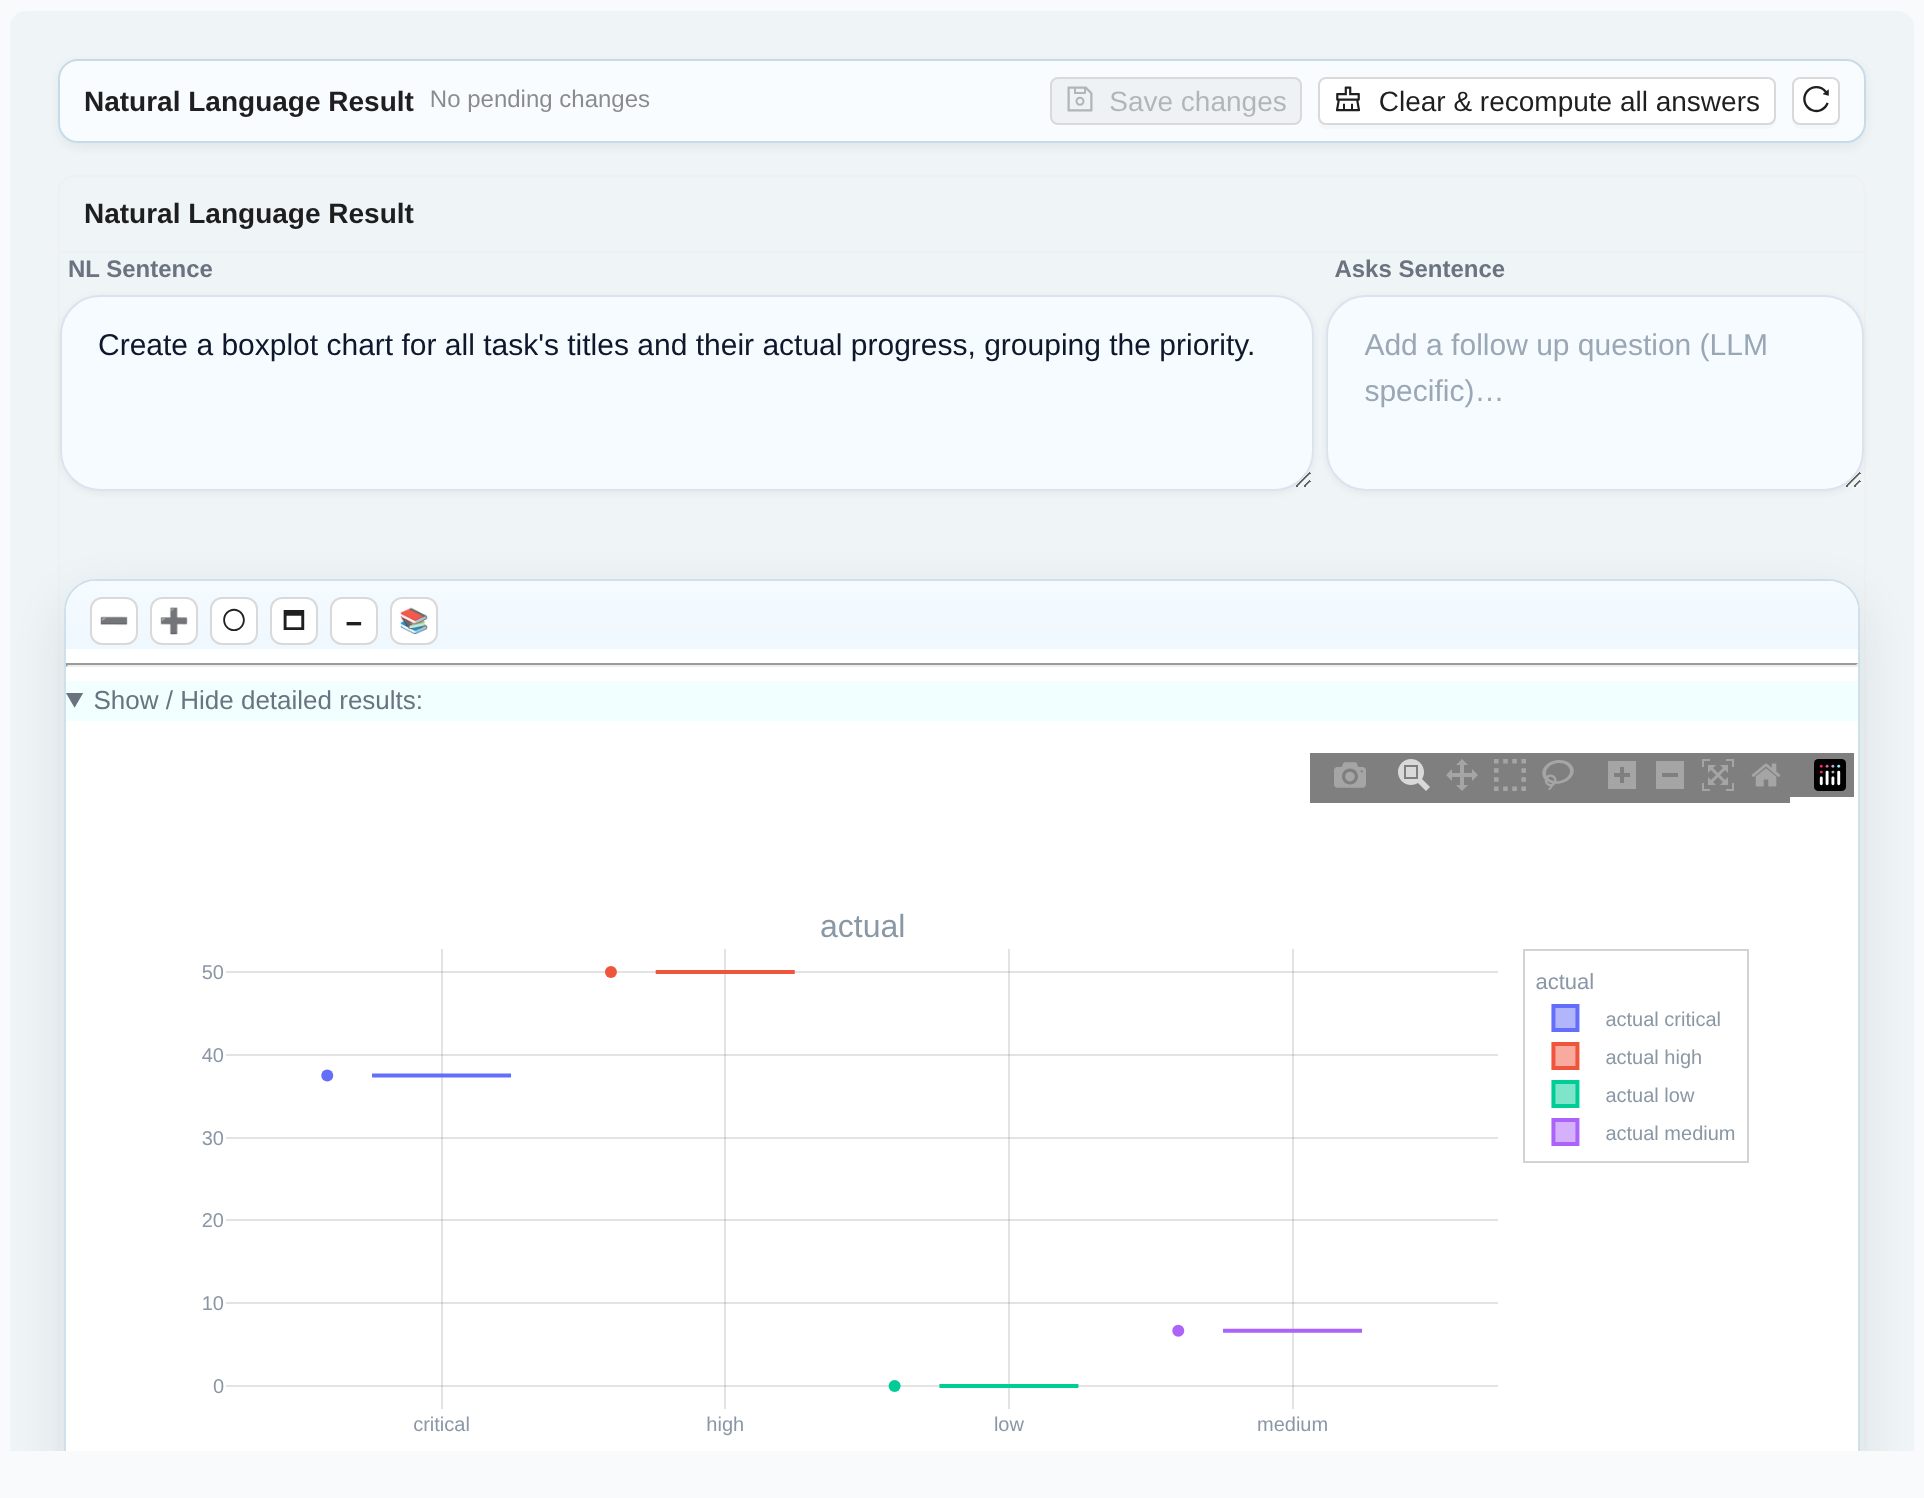
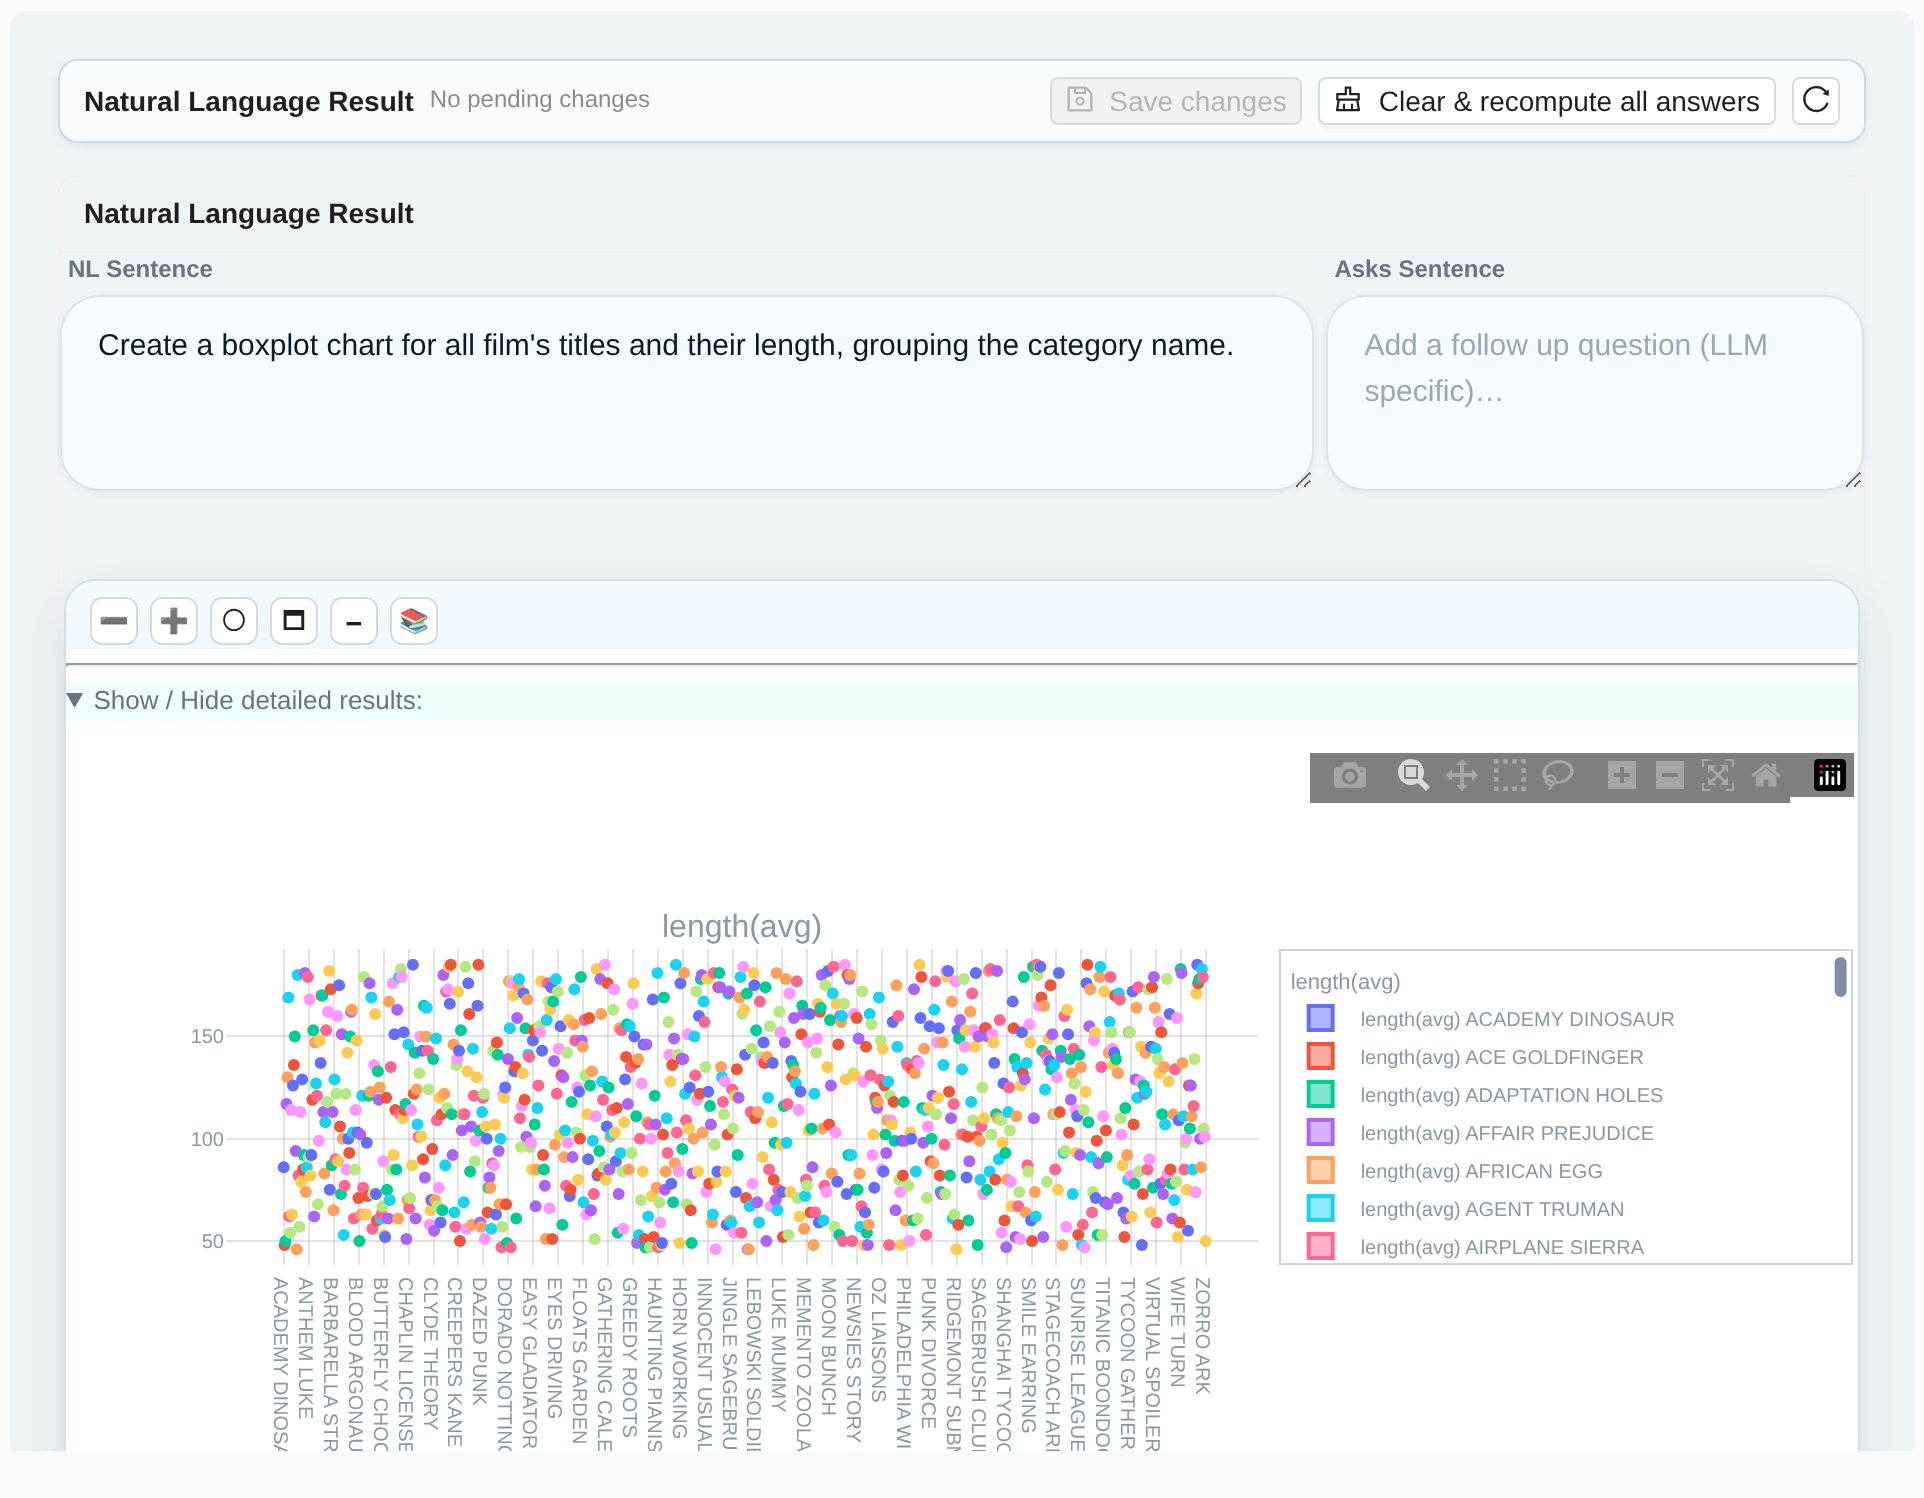
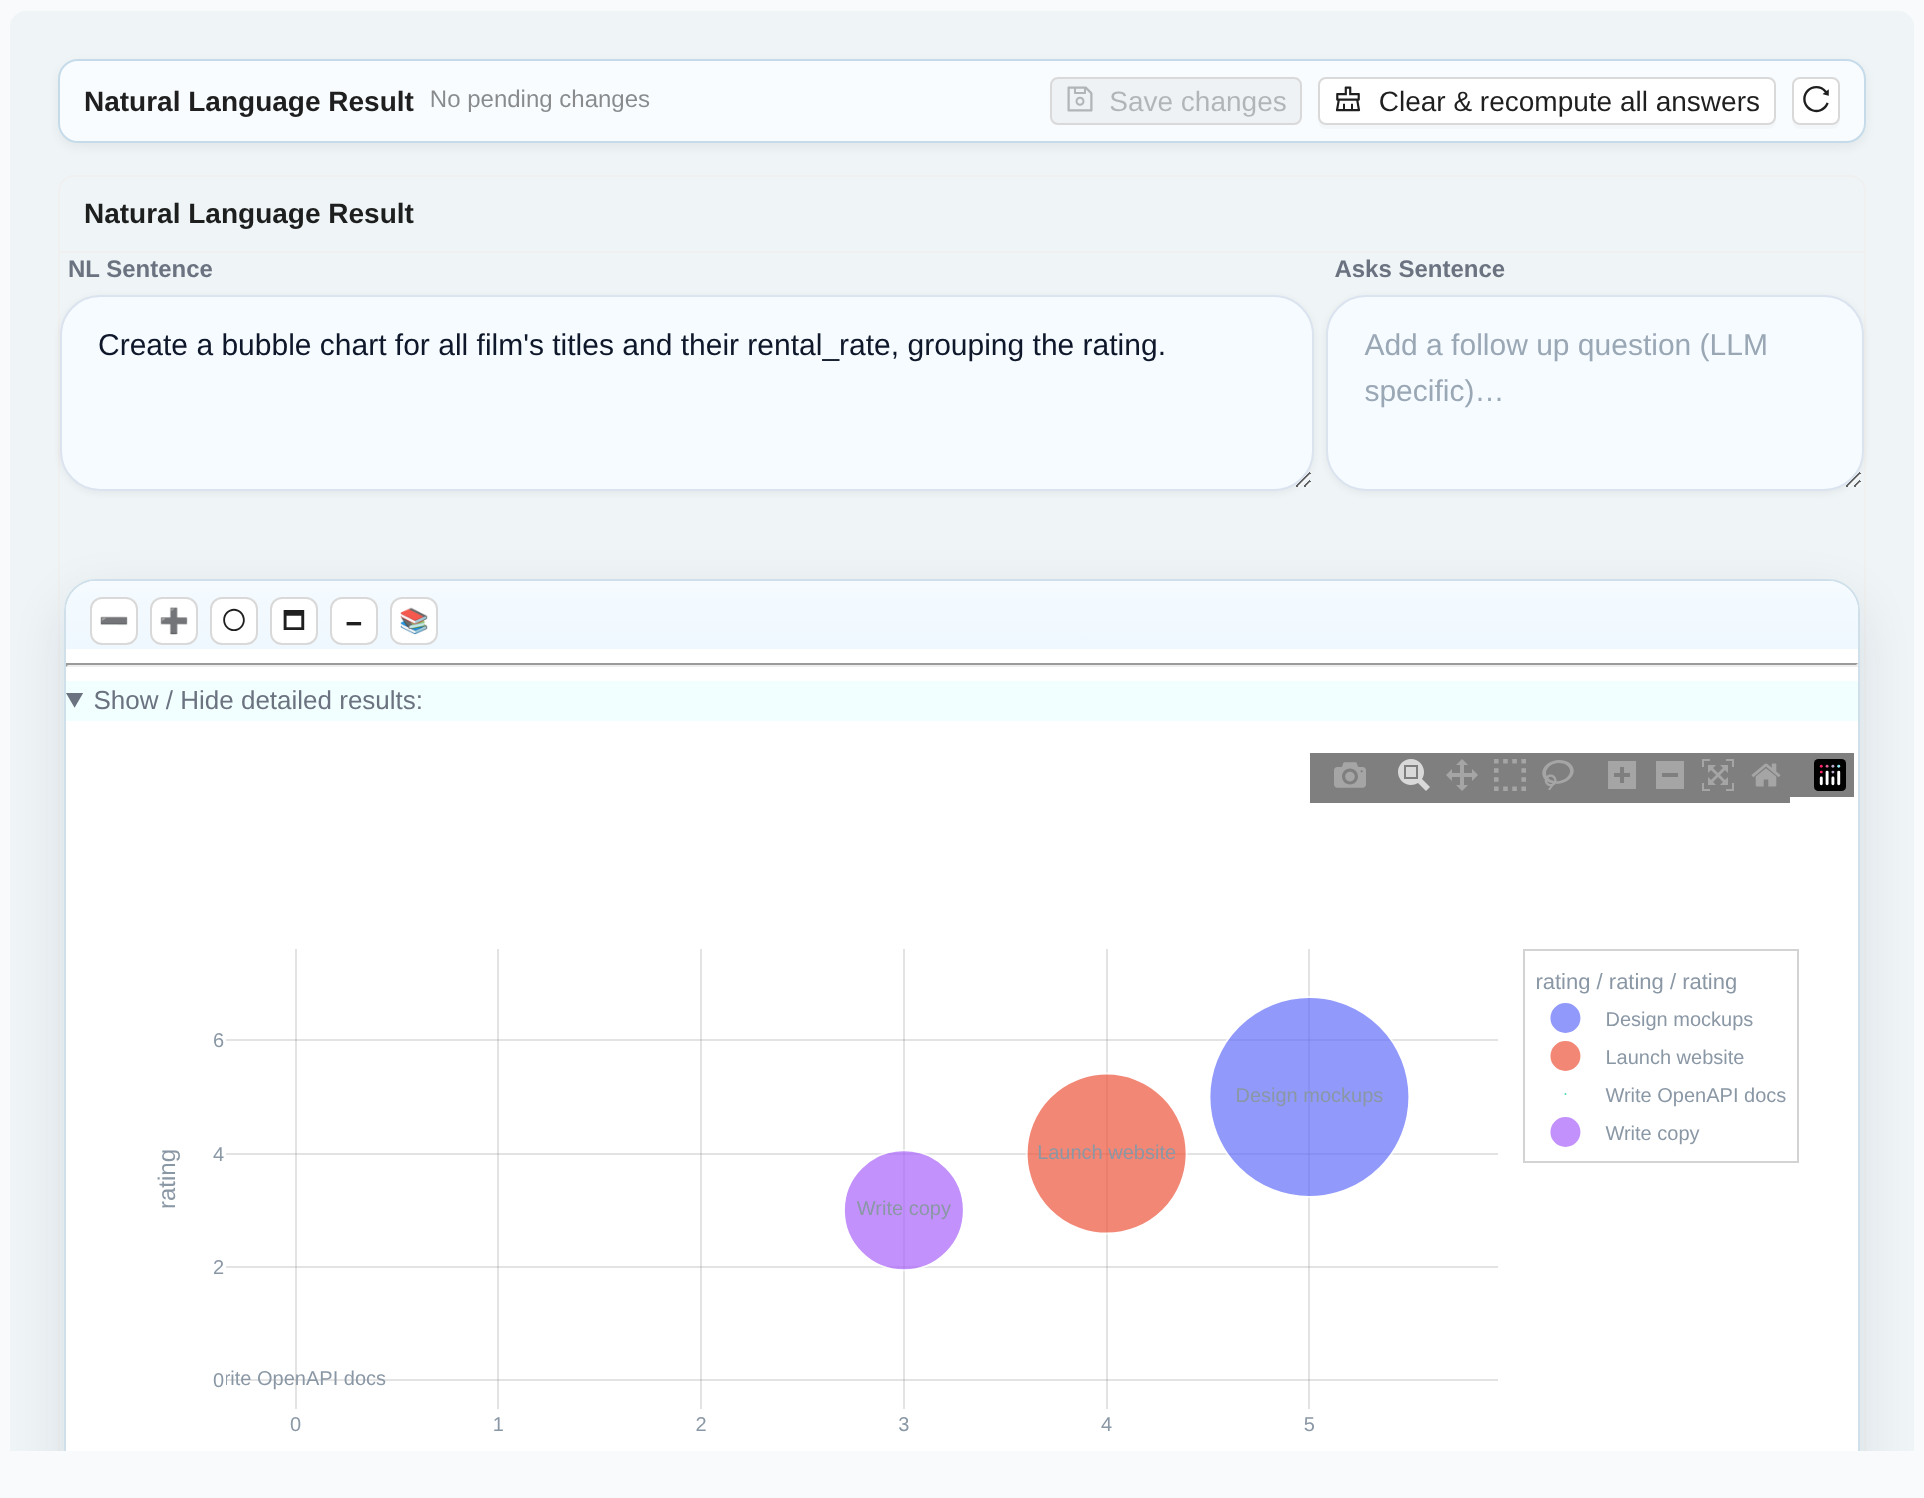
Distribution & Correlation

Boxplot and bubble charts to explore data distributions and relationships.

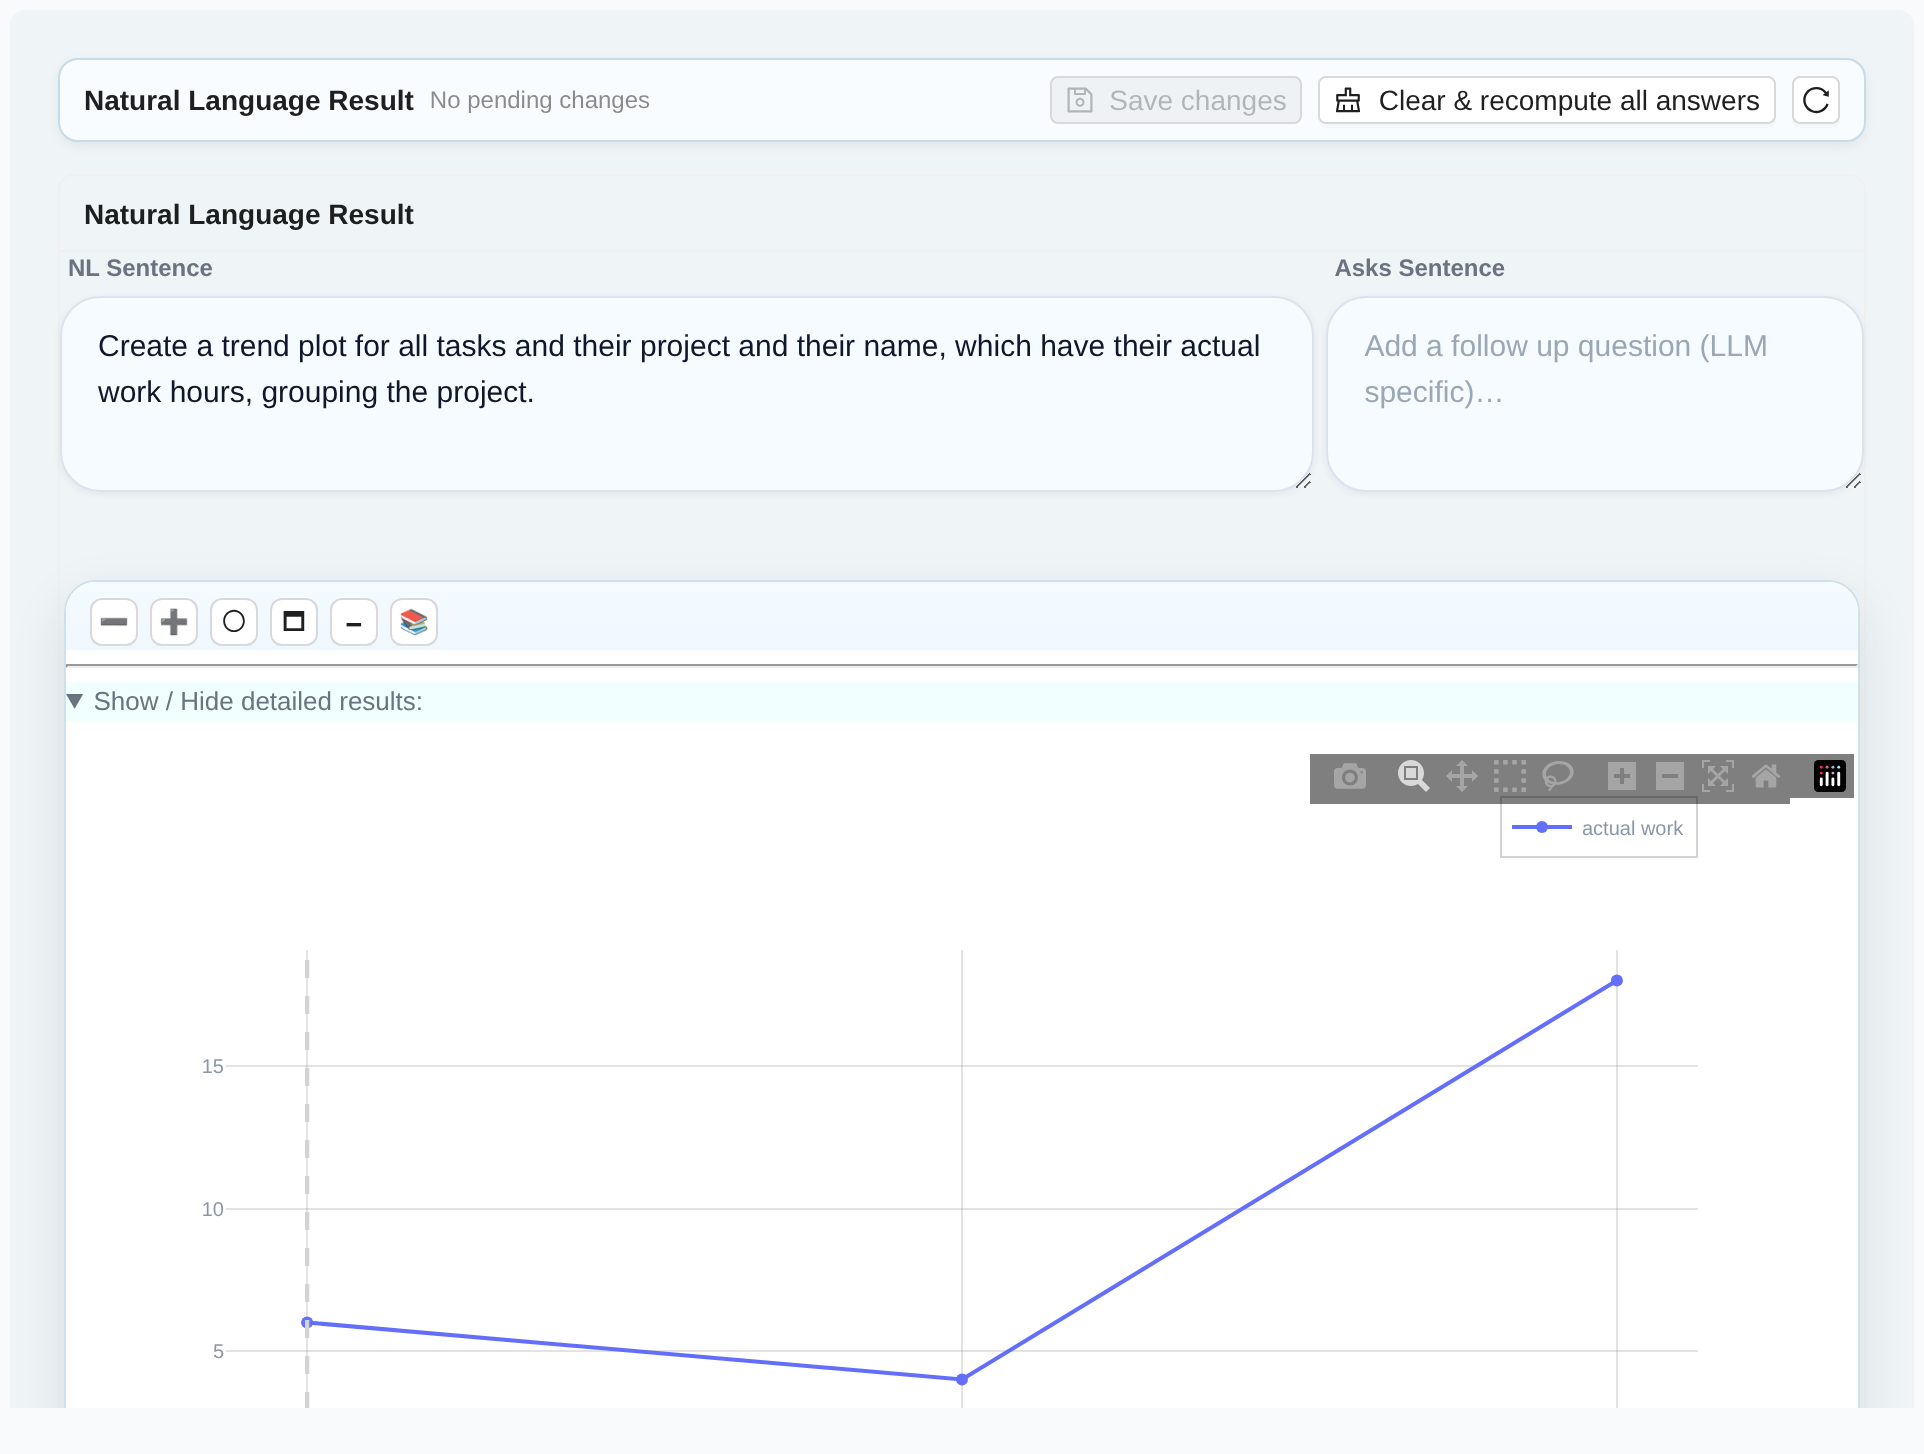
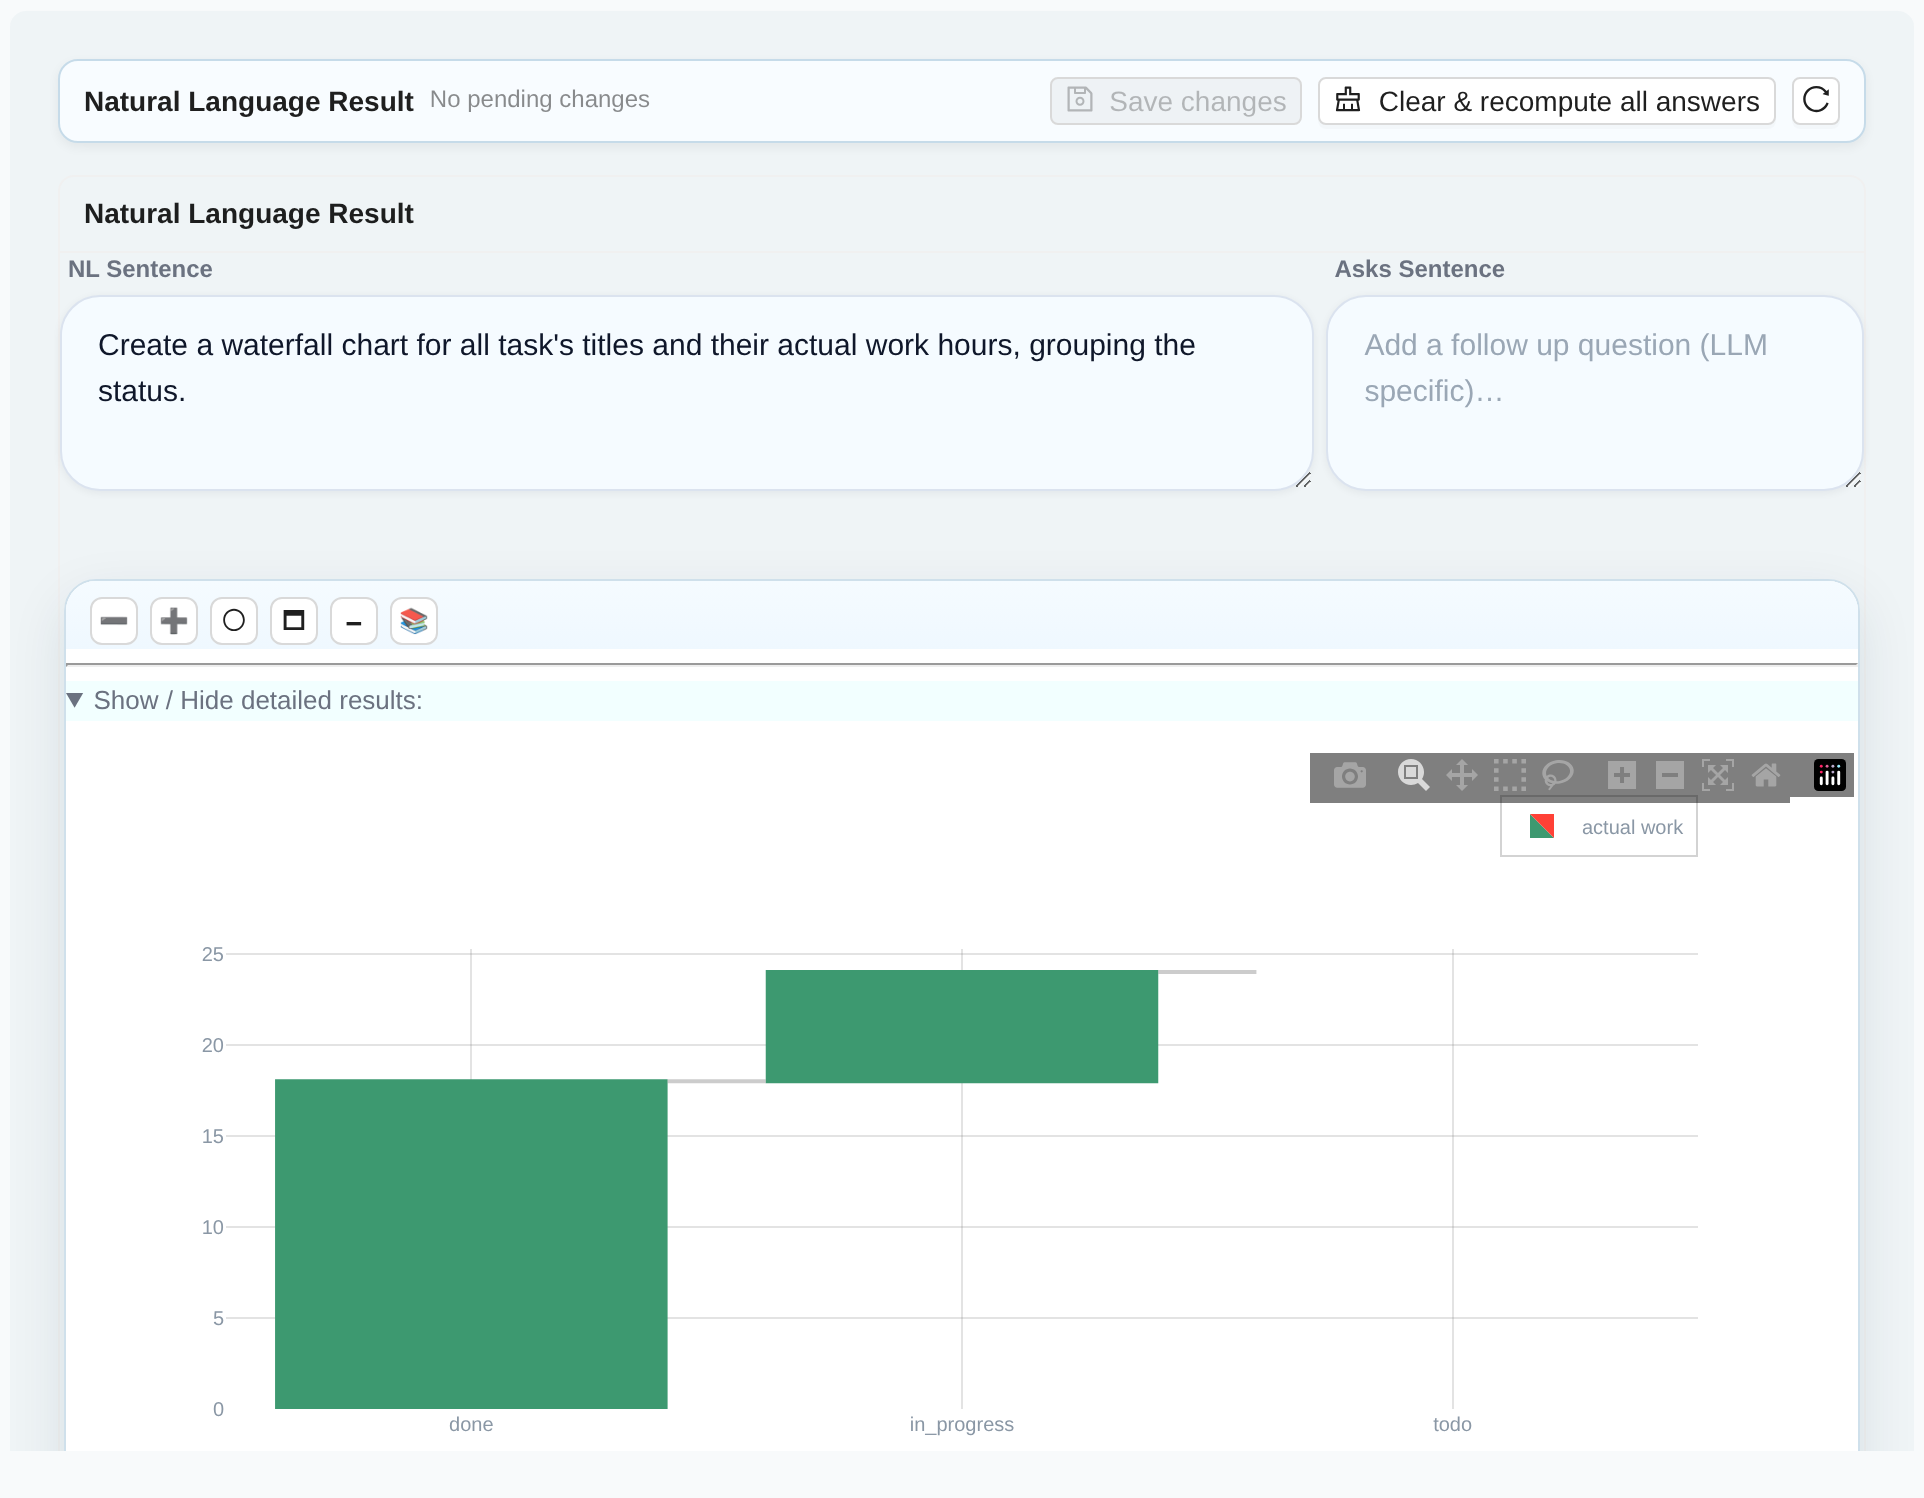
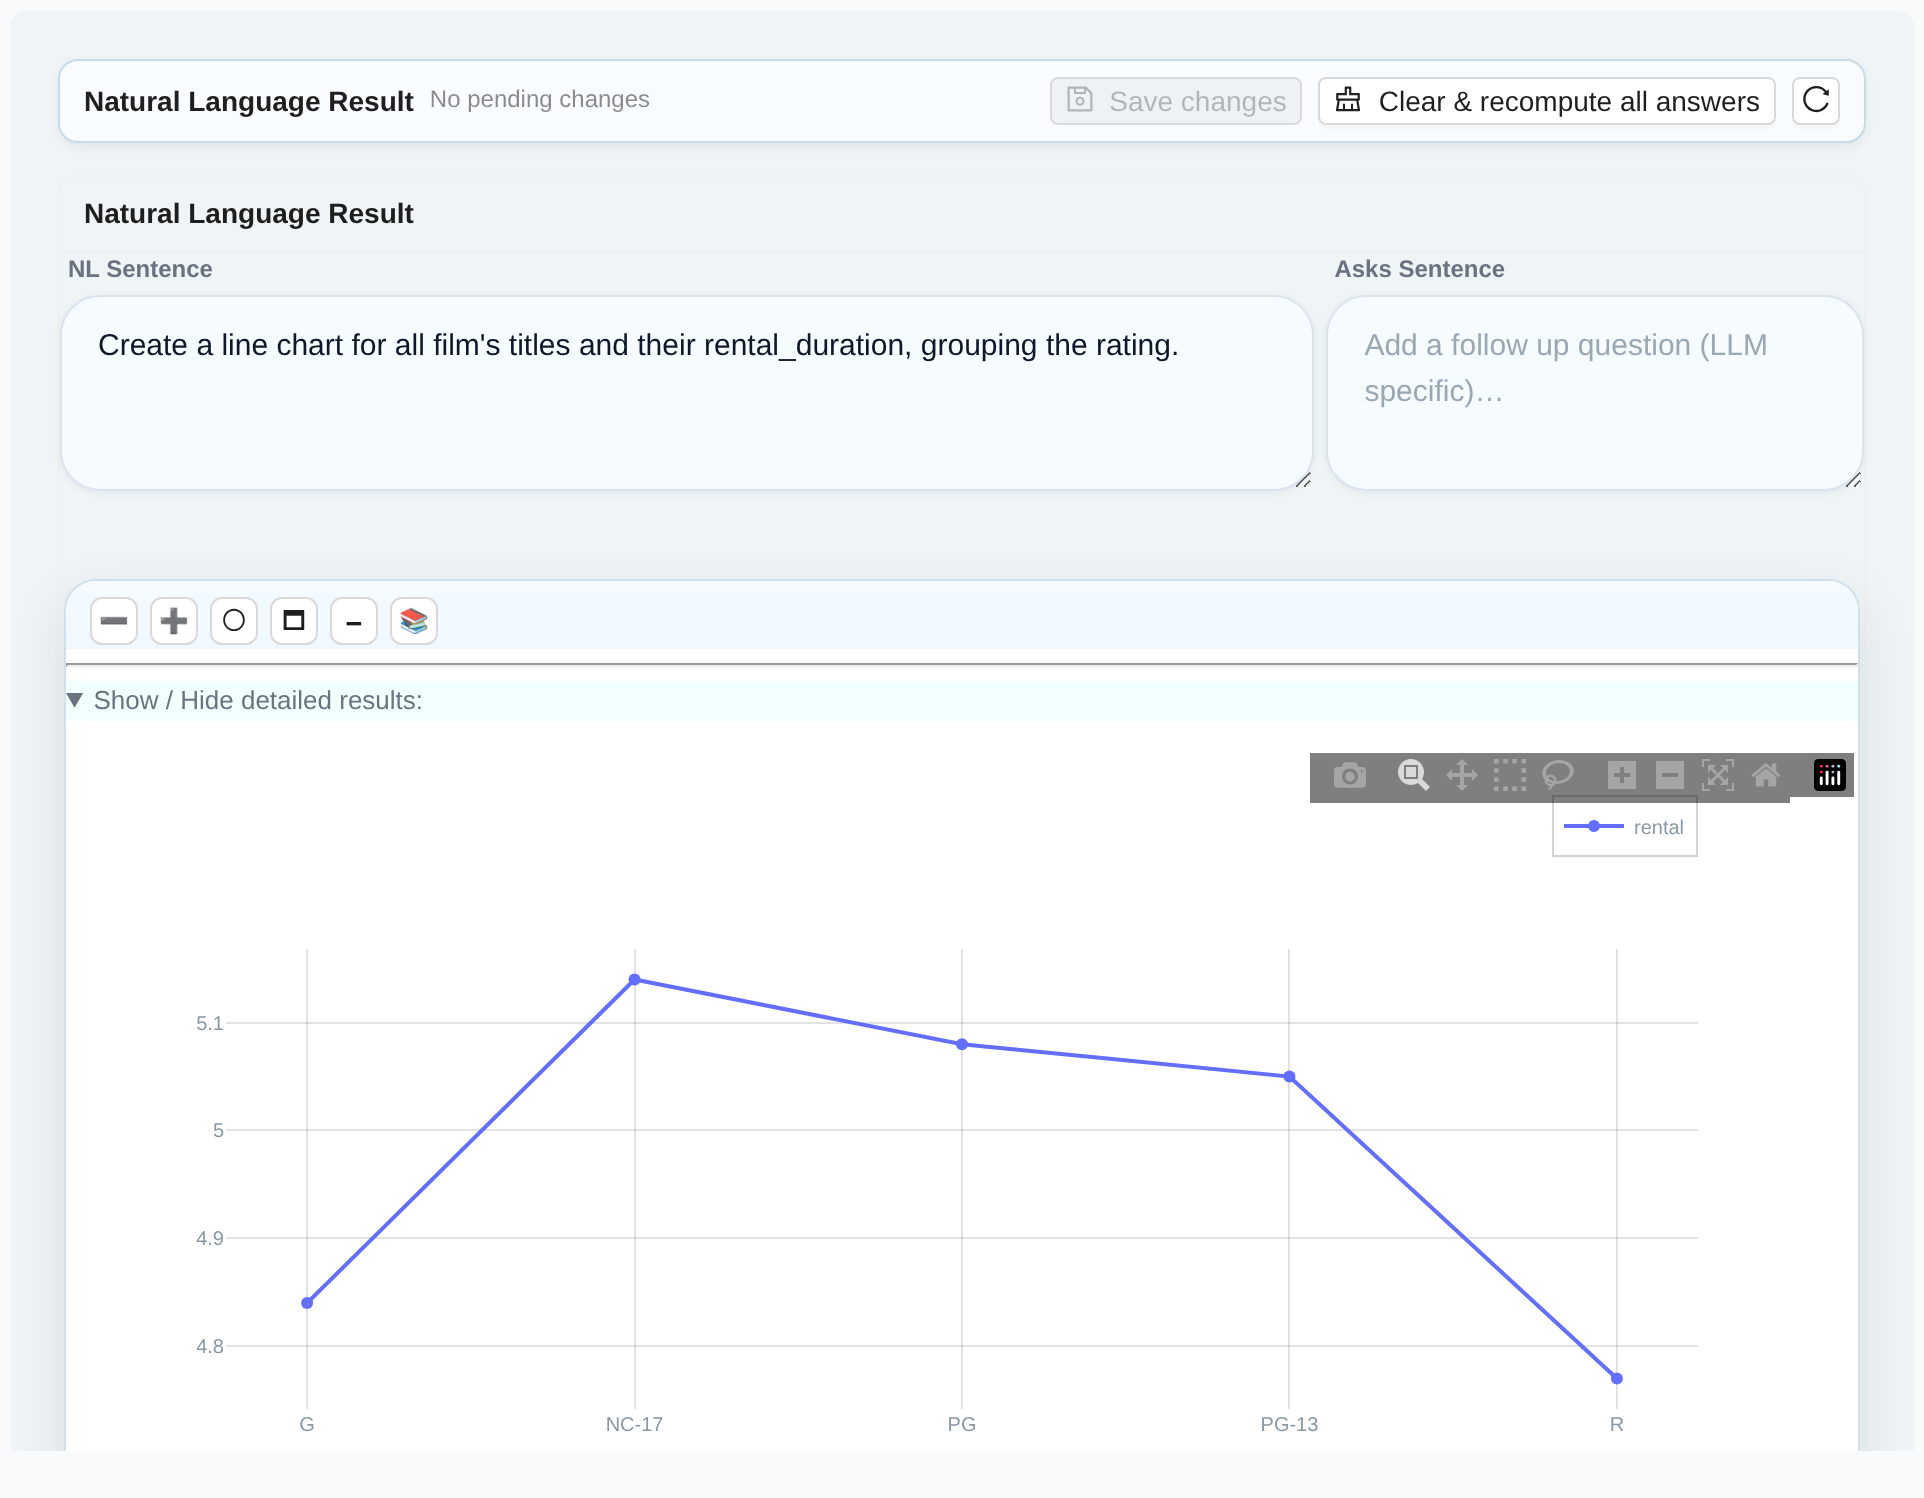
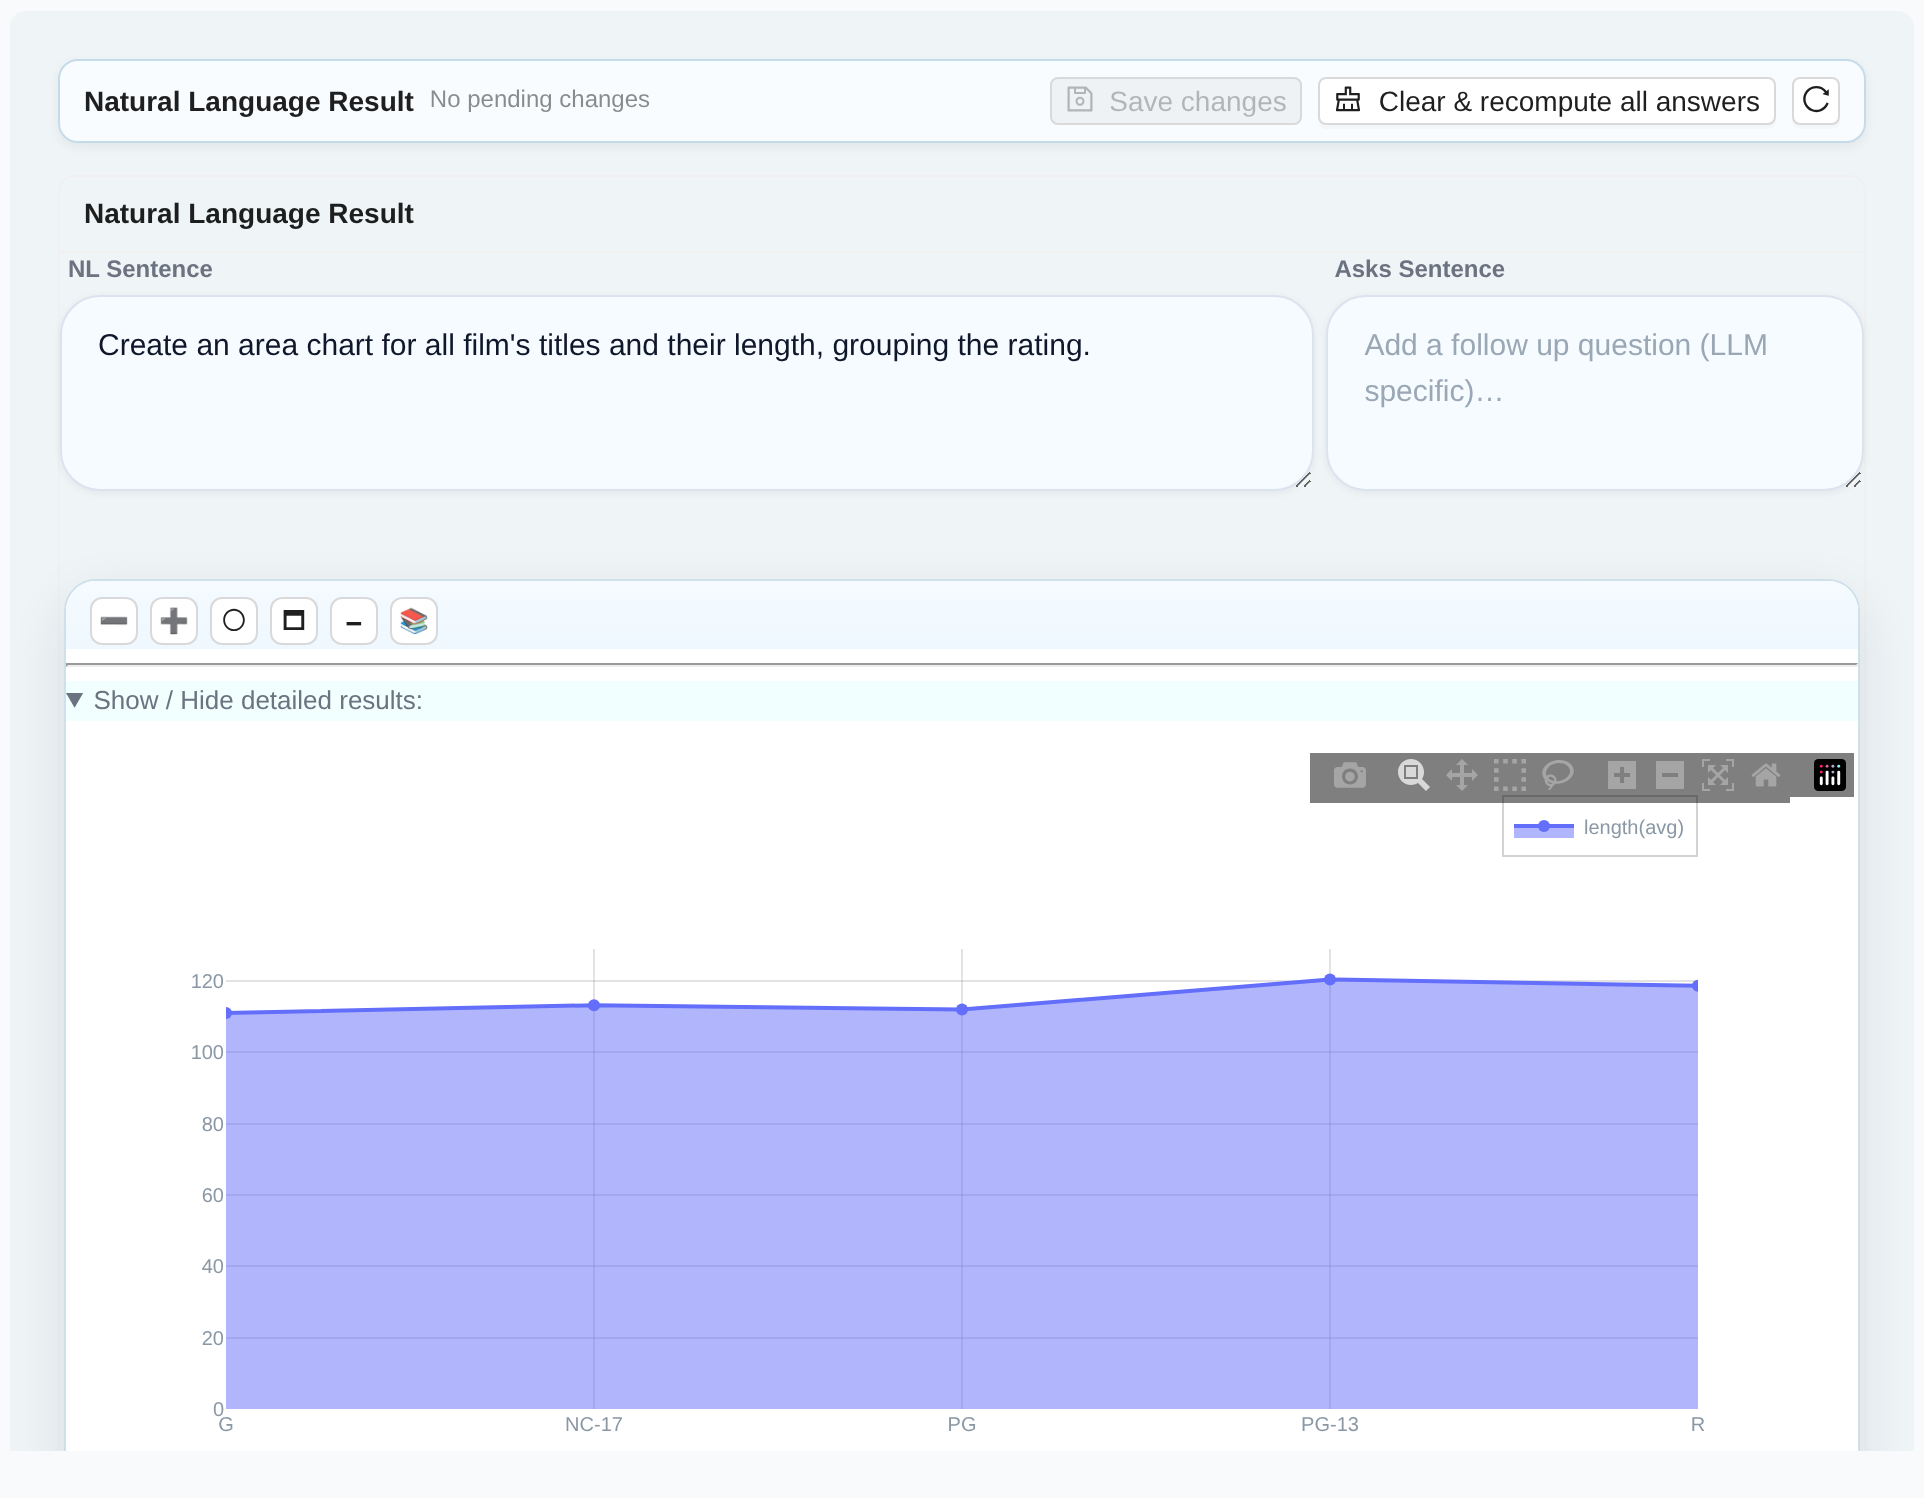
Trend & Flow

Track change over time and cumulative movement.

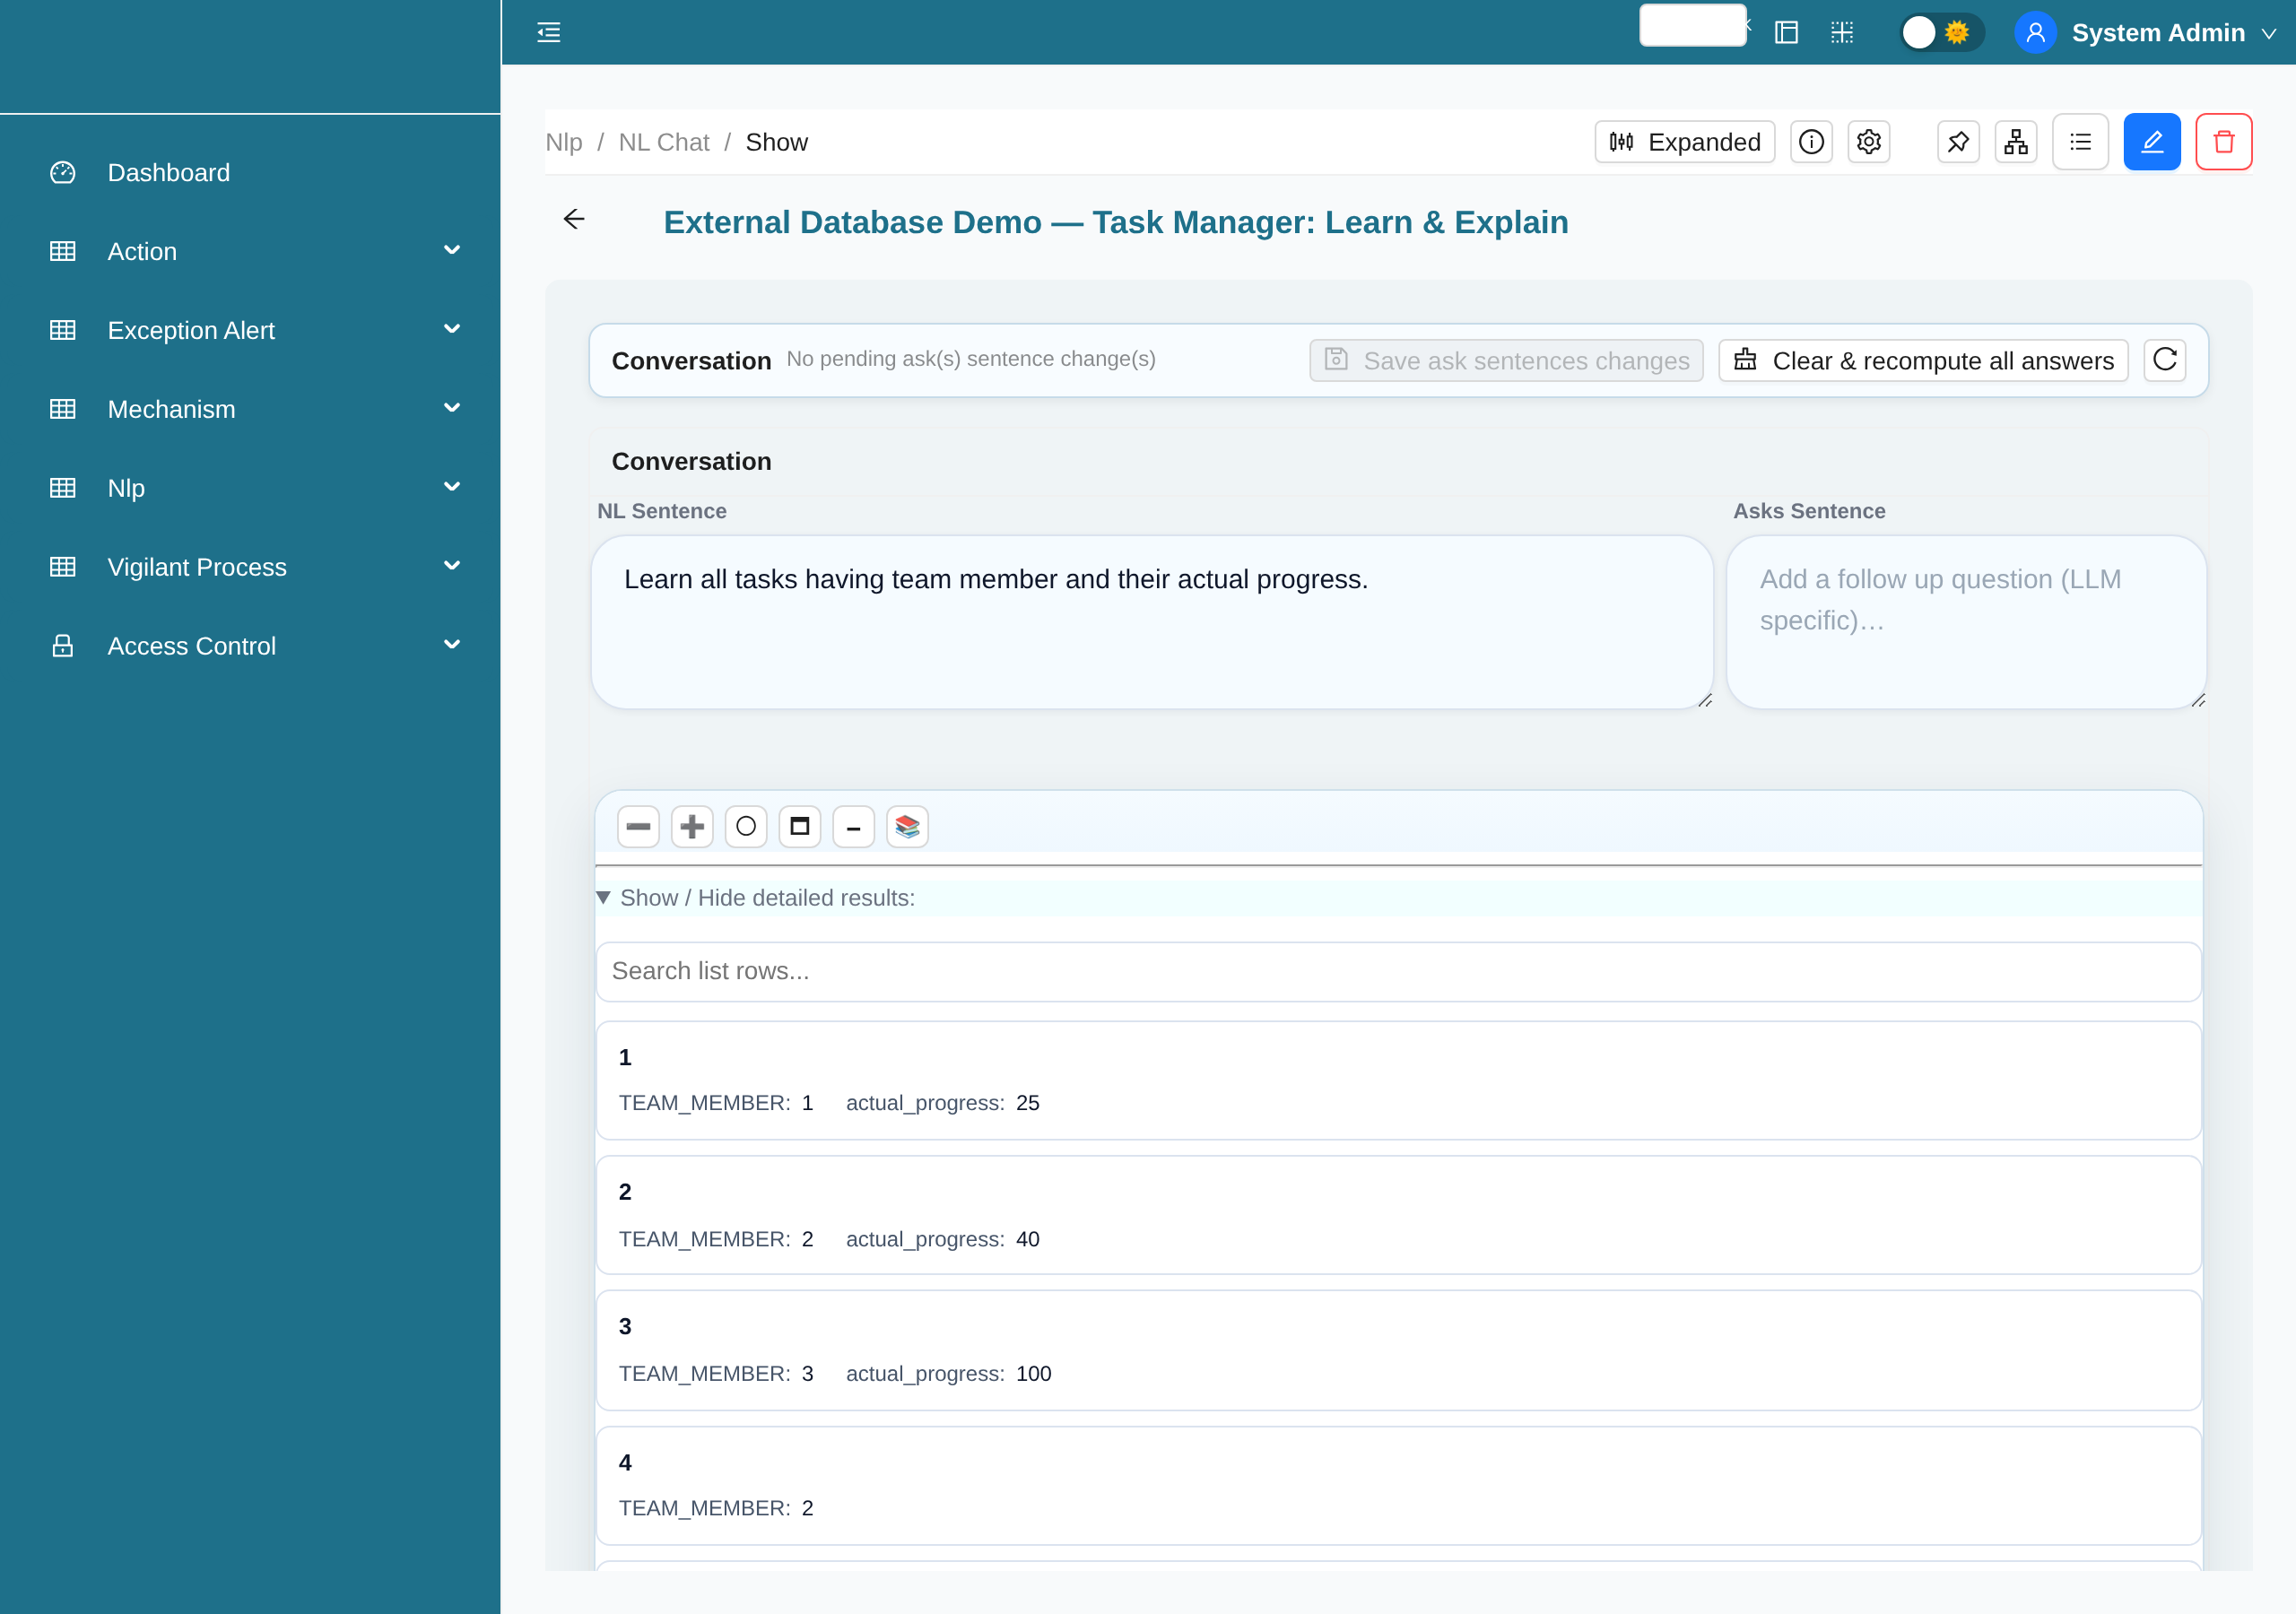
Conversational Querying

Multi-sentence conversations that mix queries, charts, and ML-style learning.

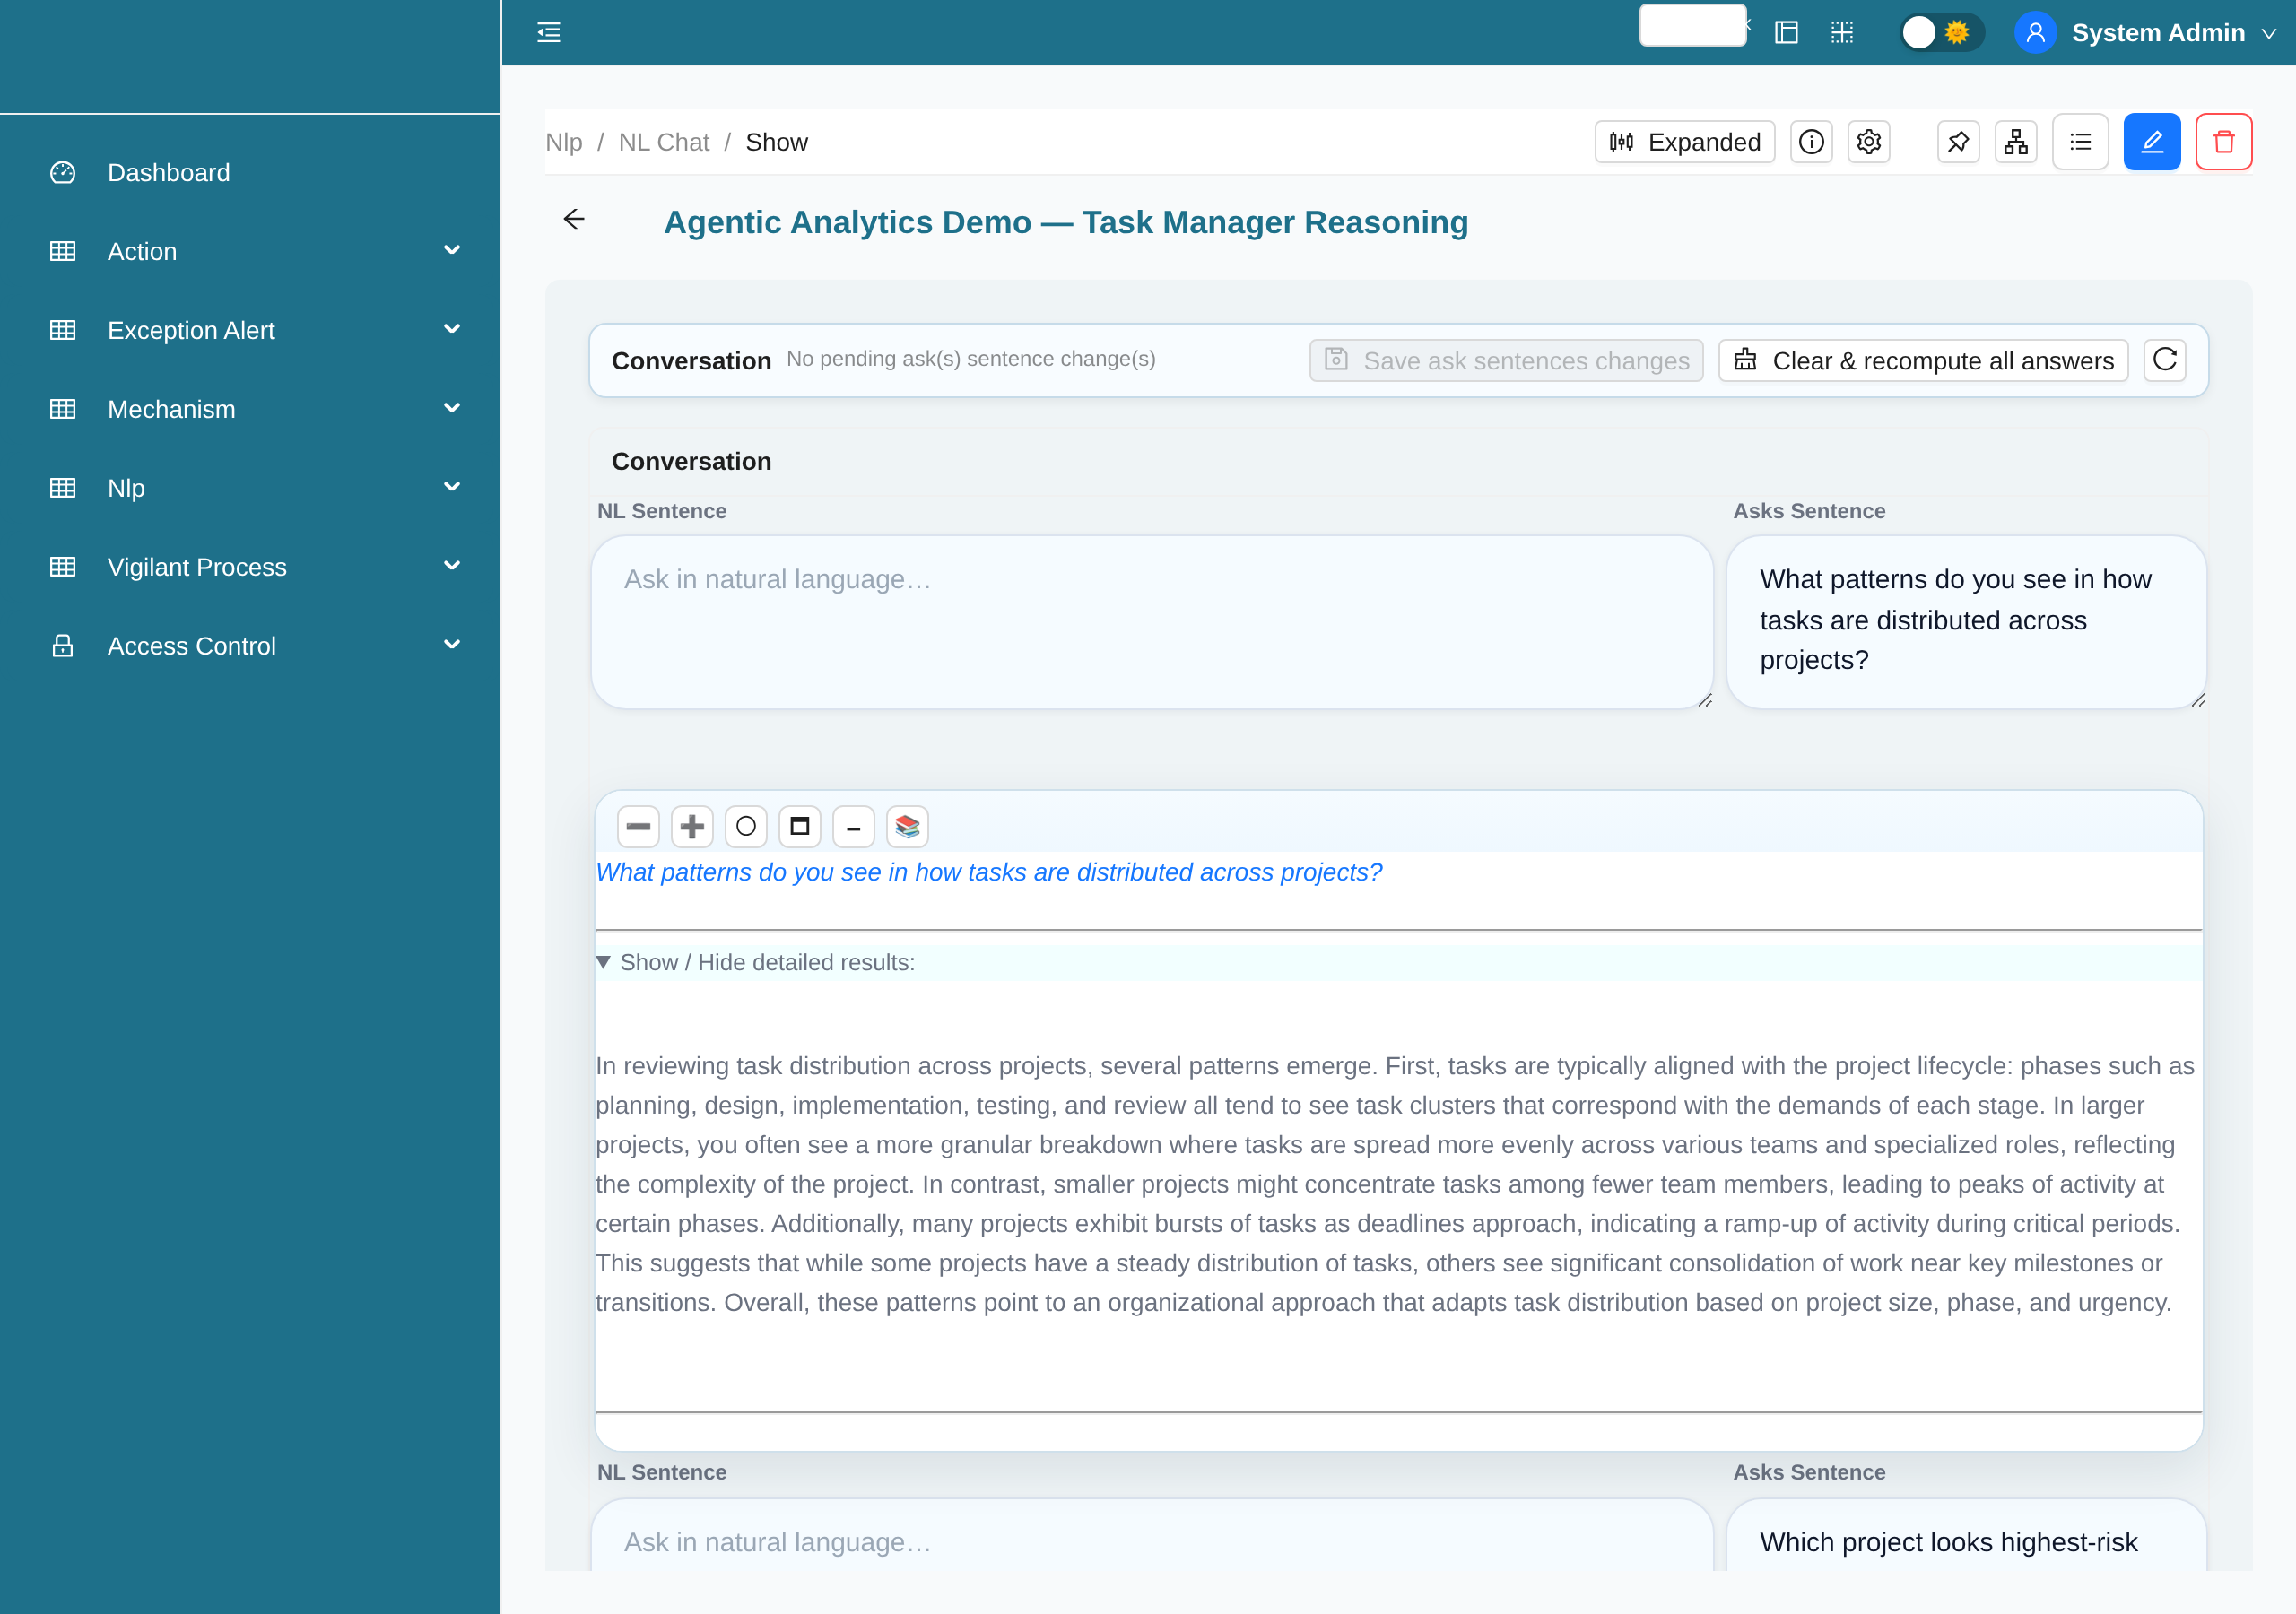
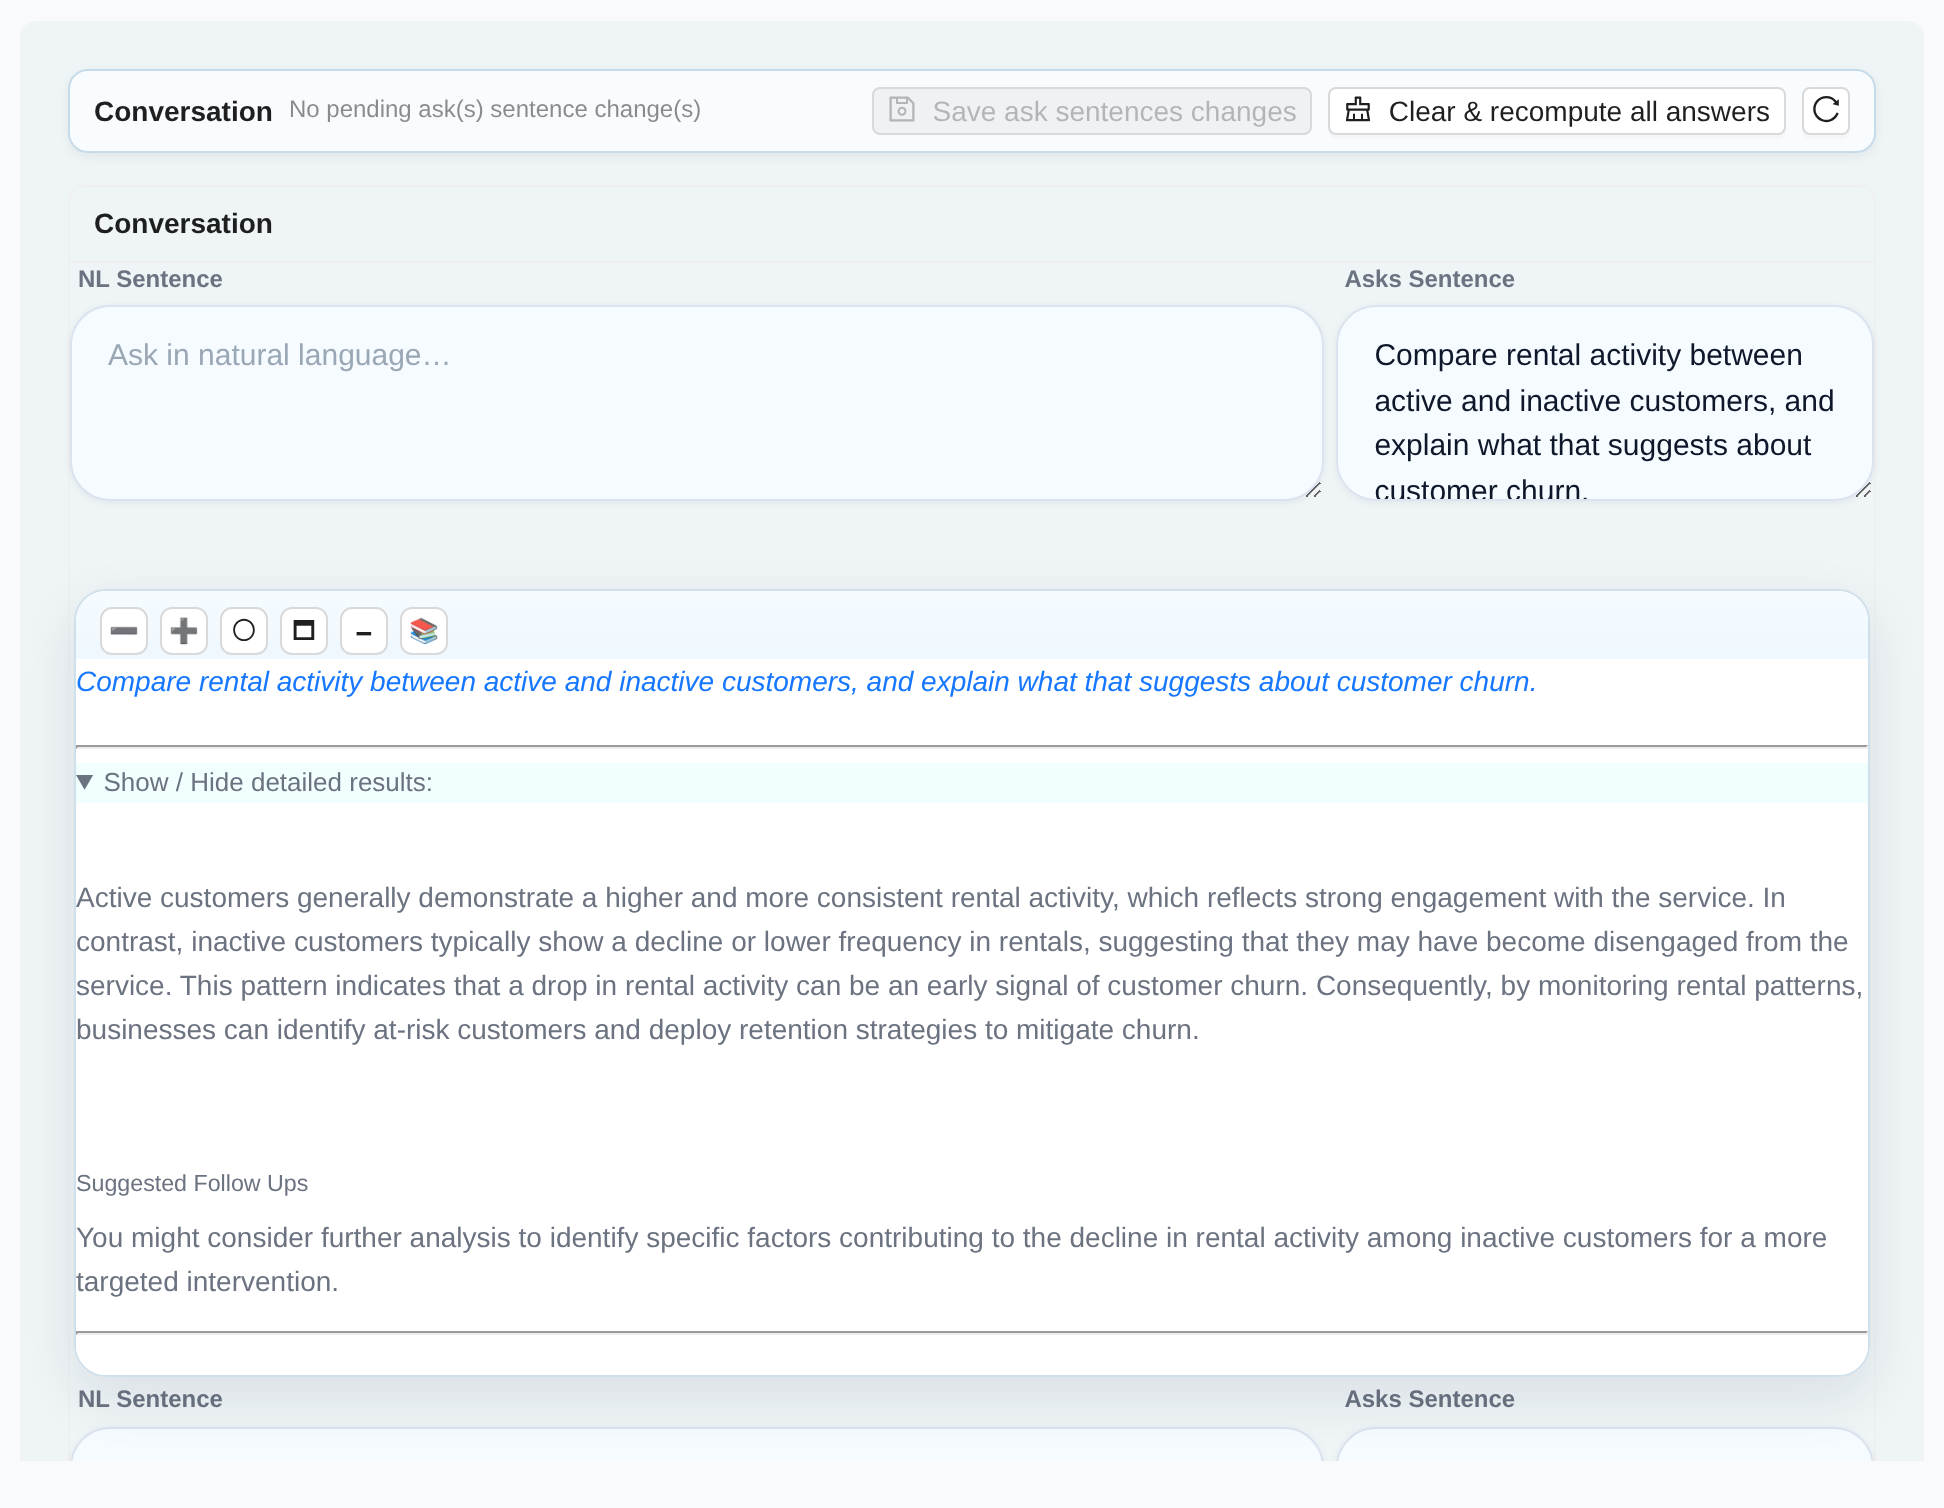
Agentic Analytical Insights

Open-ended questions answered with data-driven insights. Deterministic agents analyze your data and return plain-language conclusions.

See it live with your own data.

IQVigilant plugs into your database and delivers answers like these — instantly, with zero data engineering.

Talk to Us → Learn How It Works